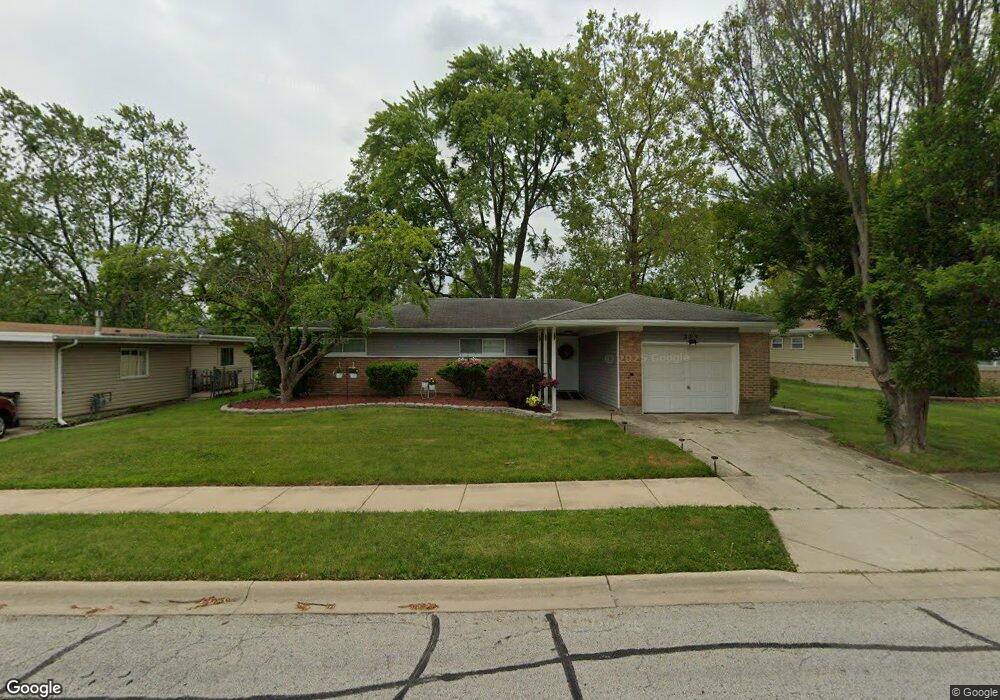
359 Wilshire St Park Forest, IL 60466
Estimated Value: $206,000 - $244,000
3
Beds
2
Baths
1,700
Sq Ft
$128/Sq Ft
Est. Value
About This Home
This home is located at 359 Wilshire St, Park Forest, IL 60466 and is currently estimated at $218,300, approximately $128 per square foot. 359 Wilshire St is a home located in Cook County with nearby schools including Michelle Obama School of Technology, Mohawk Primary Center, and Barack Obama School of Leadership and STEM.
Ownership History
Date
Name
Owned For
Owner Type
Purchase Details
Closed on
Apr 4, 2023
Sold by
Hamlin Group Inc
Bought by
Wortham Lawanna
Current Estimated Value
Home Financials for this Owner
Home Financials are based on the most recent Mortgage that was taken out on this home.
Original Mortgage
$180,667
Outstanding Balance
$175,673
Interest Rate
6.63%
Mortgage Type
FHA
Estimated Equity
$42,627
Purchase Details
Closed on
Nov 10, 2022
Sold by
Frain Laura M
Bought by
Hamlin Group Inc
Purchase Details
Closed on
Nov 4, 2006
Sold by
Frain Dorothy and Frain Richard
Bought by
Frain Richard M and Frain Laura M
Purchase Details
Closed on
Sep 8, 1994
Sold by
Hud
Bought by
Frain Richard M and Frain Dorothy T
Home Financials for this Owner
Home Financials are based on the most recent Mortgage that was taken out on this home.
Original Mortgage
$48,000
Interest Rate
8.75%
Purchase Details
Closed on
Apr 5, 1994
Sold by
Sheahan Michael F
Bought by
Hud
Create a Home Valuation Report for This Property
The Home Valuation Report is an in-depth analysis detailing your home's value as well as a comparison with similar homes in the area
Home Values in the Area
Average Home Value in this Area
Purchase History
| Date | Buyer | Sale Price | Title Company |
|---|---|---|---|
| Wortham Lawanna | $184,000 | None Listed On Document | |
| Hamlin Group Inc | $65,500 | Chicago Title | |
| Frain Richard M | -- | None Available | |
| Frain Richard M | -- | Attorneys Title Guaranty Fun | |
| Hud | -- | -- |
Source: Public Records
Mortgage History
| Date | Status | Borrower | Loan Amount |
|---|---|---|---|
| Open | Wortham Lawanna | $180,667 | |
| Previous Owner | Frain Richard M | $48,000 |
Source: Public Records
Tax History Compared to Growth
Tax History
| Year | Tax Paid | Tax Assessment Tax Assessment Total Assessment is a certain percentage of the fair market value that is determined by local assessors to be the total taxable value of land and additions on the property. | Land | Improvement |
|---|---|---|---|---|
| 2024 | $12,390 | $16,926 | $3,026 | $13,900 |
| 2023 | $9,473 | $16,926 | $3,026 | $13,900 |
| 2022 | $9,473 | $7,047 | $2,810 | $4,237 |
| 2021 | $9,296 | $7,045 | $2,809 | $4,236 |
| 2020 | $8,475 | $7,045 | $2,809 | $4,236 |
| 2019 | $9,610 | $8,829 | $2,593 | $6,236 |
| 2018 | $9,261 | $8,829 | $2,593 | $6,236 |
| 2017 | $9,204 | $8,829 | $2,593 | $6,236 |
| 2016 | $8,122 | $8,170 | $2,377 | $5,793 |
| 2015 | $7,938 | $8,170 | $2,377 | $5,793 |
| 2014 | $7,704 | $8,170 | $2,377 | $5,793 |
| 2013 | $6,602 | $7,814 | $2,377 | $5,437 |
Source: Public Records
Map
Nearby Homes
- 354 Winona St
- 505 Wildwood Dr
- 374 Sauk Trail
- 569 Lakewood Blvd
- 510 Wildwood Dr
- 506 Wildwood Dr
- 403 Wilshire St
- 124 Wilson St
- 574 Lakewood Blvd
- 409 Wilshire St
- 216 Washington St
- 408 Westgate Dr
- 413 Wilshire St
- 363 Minocqua St
- 406 Sauk Trail
- 344 Sauk Trail
- 109 Walnut St
- 340 Sauk Trail
- 408 Sauk Trail
- 197 Washington St
- 357 Wilshire St
- 361 Wilshire St
- 355 Wilshire St
- 546 Lakewood Blvd
- 363 Wilshire St
- 544 Lakewood Blvd
- 548 Lakewood Blvd
- 542 Lakewood Blvd
- 356 Wilshire St
- 360 Wilshire St
- 365 Wilshire St
- 550 Lakewood Blvd
- 353 Wilshire St
- 362 Wilshire St
- 354 Wilshire St
- 540 Lakewood Blvd
- 367 Wilshire St
- 364 Wilshire St
- 552 Lakewood Blvd
- 352 Wilshire St