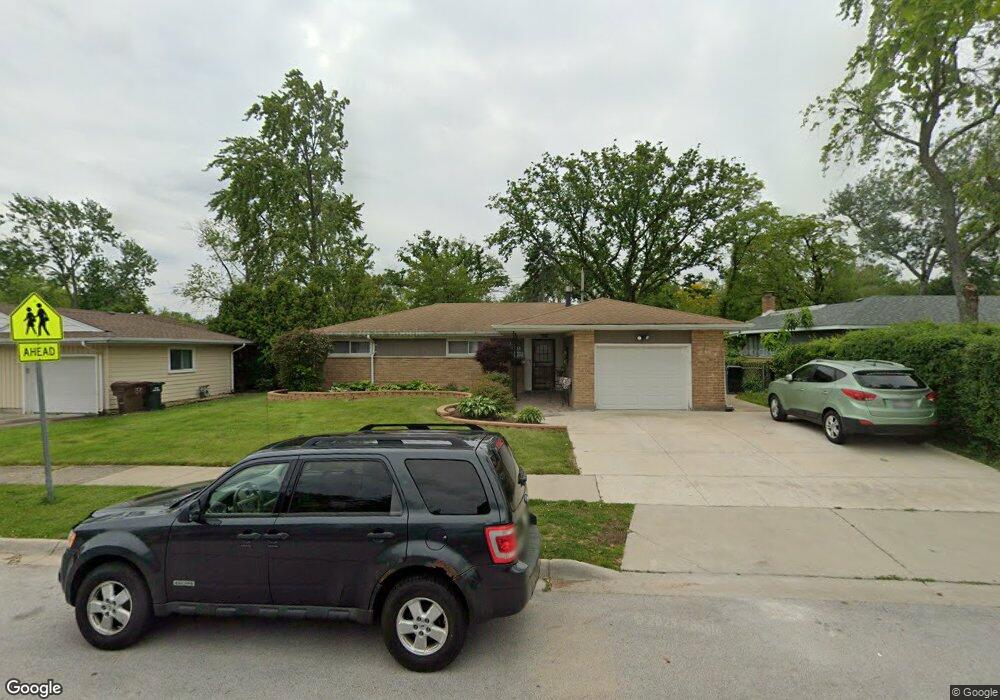
359 Winona St Park Forest, IL 60466
Estimated Value: $139,000 - $221,000
3
Beds
2
Baths
1,761
Sq Ft
$99/Sq Ft
Est. Value
About This Home
This home is located at 359 Winona St, Park Forest, IL 60466 and is currently estimated at $175,091, approximately $99 per square foot. 359 Winona St is a home located in Cook County with nearby schools including Michelle Obama School of Technology, Mohawk Primary Center, and Barack Obama School of Leadership and STEM.
Ownership History
Date
Name
Owned For
Owner Type
Purchase Details
Closed on
Mar 6, 2017
Sold by
Hennis Daniel
Bought by
Reed Jackqueline K
Current Estimated Value
Home Financials for this Owner
Home Financials are based on the most recent Mortgage that was taken out on this home.
Original Mortgage
$85,880
Outstanding Balance
$72,558
Interest Rate
4.87%
Mortgage Type
New Conventional
Estimated Equity
$102,533
Purchase Details
Closed on
May 18, 2016
Sold by
Vr Investments Co
Bought by
Bright Stripe Contractors Inc
Purchase Details
Closed on
Apr 4, 2016
Sold by
Bank Of America Na
Bought by
Yr Investment Company
Purchase Details
Closed on
Oct 23, 2004
Sold by
Davis Mary E and Cleveland Leslie
Bought by
Brown Thelma and Brown Daisy
Home Financials for this Owner
Home Financials are based on the most recent Mortgage that was taken out on this home.
Original Mortgage
$128,483
Interest Rate
5.8%
Mortgage Type
FHA
Create a Home Valuation Report for This Property
The Home Valuation Report is an in-depth analysis detailing your home's value as well as a comparison with similar homes in the area
Home Values in the Area
Average Home Value in this Area
Purchase History
| Date | Buyer | Sale Price | Title Company |
|---|---|---|---|
| Reed Jackqueline K | $90,500 | Old Republic Title | |
| Bright Stripe Contractors Inc | $25,000 | Chicago Title Insurance Comp | |
| Yr Investment Company | $16,000 | Attorney | |
| Brown Thelma | $130,500 | -- |
Source: Public Records
Mortgage History
| Date | Status | Borrower | Loan Amount |
|---|---|---|---|
| Open | Reed Jackqueline K | $85,880 | |
| Previous Owner | Brown Thelma | $128,483 |
Source: Public Records
Tax History Compared to Growth
Tax History
| Year | Tax Paid | Tax Assessment Tax Assessment Total Assessment is a certain percentage of the fair market value that is determined by local assessors to be the total taxable value of land and additions on the property. | Land | Improvement |
|---|---|---|---|---|
| 2024 | $8,067 | $15,000 | $2,744 | $12,256 |
| 2023 | $4,538 | $15,000 | $2,744 | $12,256 |
| 2022 | $4,538 | $7,480 | $2,548 | $4,932 |
| 2021 | $4,595 | $7,479 | $2,548 | $4,931 |
| 2020 | $4,519 | $7,479 | $2,548 | $4,931 |
| 2019 | $5,933 | $8,880 | $2,352 | $6,528 |
| 2018 | $9,315 | $8,880 | $2,352 | $6,528 |
| 2017 | $5,739 | $8,880 | $2,352 | $6,528 |
| 2016 | $6,098 | $8,631 | $2,156 | $6,475 |
| 2015 | $5,837 | $8,631 | $2,156 | $6,475 |
| 2014 | $5,717 | $8,631 | $2,156 | $6,475 |
| 2013 | $5,485 | $9,122 | $2,156 | $6,966 |
Source: Public Records
Map
Nearby Homes
- 354 Winona St
- 505 Wildwood Dr
- 124 Wilson St
- 506 Wildwood Dr
- 510 Wildwood Dr
- 109 Walnut St
- 403 Wilshire St
- 408 Westgate Dr
- 374 Sauk Trail
- 569 Lakewood Blvd
- 433 Wildwood Dr
- 216 Washington St
- 409 Wilshire St
- 197 Washington St
- 574 Lakewood Blvd
- 413 Wilshire St
- 363 Winnebago St
- 206 Westwood Dr
- 406 Sauk Trail
- 344 Sauk Trail