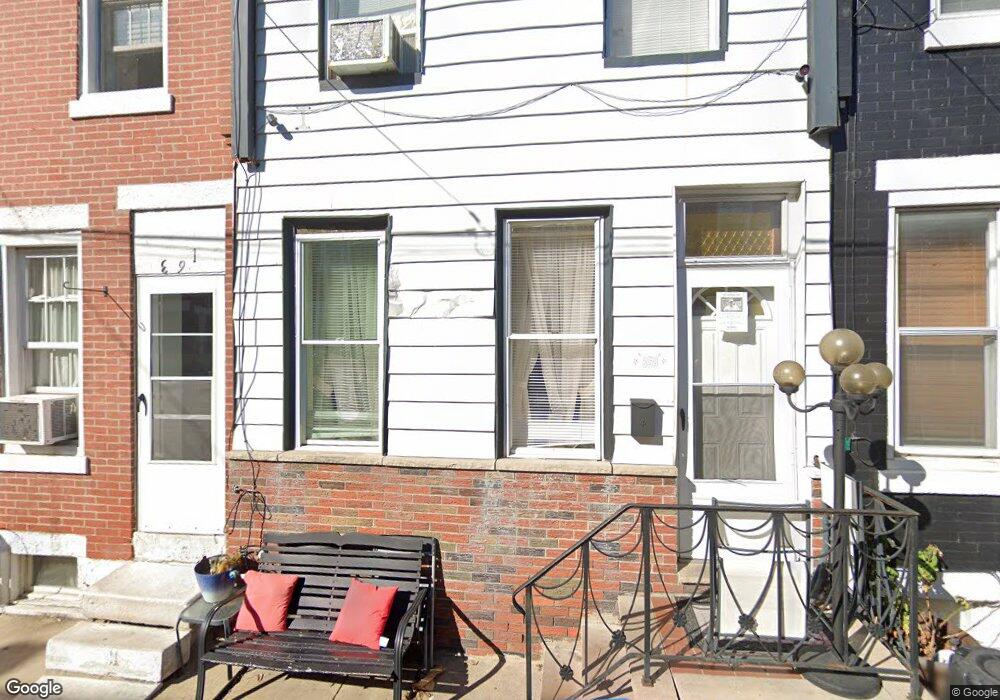
359 Winton St Philadelphia, PA 19148
Whitman NeighborhoodEstimated Value: $216,000 - $243,000
2
Beds
1
Bath
840
Sq Ft
$274/Sq Ft
Est. Value
About This Home
This home is located at 359 Winton St, Philadelphia, PA 19148 and is currently estimated at $229,742, approximately $273 per square foot. 359 Winton St is a home located in Philadelphia County with nearby schools including George W. Sharswood School, Furness Horace High School, and St. Casimir School.
Ownership History
Date
Name
Owned For
Owner Type
Purchase Details
Closed on
Dec 24, 2008
Sold by
Deutsche Bank National Trust Company
Bought by
Kalam Mohammad
Current Estimated Value
Purchase Details
Closed on
Apr 28, 2008
Sold by
Mankin Robert
Bought by
Deutsche Bank National Trust Co and Long Beach Mortgage Loan Trust 2005-1
Purchase Details
Closed on
Feb 5, 2004
Sold by
Hud
Bought by
Mankin Robert
Purchase Details
Closed on
Feb 24, 2003
Sold by
Stanton Blanche and Estate Of Thomas J Stanton
Bought by
Hud
Create a Home Valuation Report for This Property
The Home Valuation Report is an in-depth analysis detailing your home's value as well as a comparison with similar homes in the area
Home Values in the Area
Average Home Value in this Area
Purchase History
| Date | Buyer | Sale Price | Title Company |
|---|---|---|---|
| Kalam Mohammad | $57,000 | None Available | |
| Deutsche Bank National Trust Co | $11,000 | None Available | |
| Mankin Robert | $36,500 | -- | |
| Hud | $35,000 | -- |
Source: Public Records
Tax History Compared to Growth
Tax History
| Year | Tax Paid | Tax Assessment Tax Assessment Total Assessment is a certain percentage of the fair market value that is determined by local assessors to be the total taxable value of land and additions on the property. | Land | Improvement |
|---|---|---|---|---|
| 2026 | $2,535 | $213,900 | $42,780 | $171,120 |
| 2025 | $2,535 | $213,900 | $42,780 | $171,120 |
| 2024 | $2,535 | $213,900 | $42,780 | $171,120 |
| 2023 | $2,535 | $181,100 | $36,220 | $144,880 |
| 2022 | $2,182 | $181,100 | $36,220 | $144,880 |
| 2021 | $2,182 | $0 | $0 | $0 |
| 2020 | $2,182 | $0 | $0 | $0 |
| 2019 | $2,014 | $0 | $0 | $0 |
| 2018 | $1,120 | $0 | $0 | $0 |
| 2017 | $1,120 | $0 | $0 | $0 |
| 2016 | $141 | $0 | $0 | $0 |
| 2015 | $2,030 | $0 | $0 | $0 |
| 2014 | -- | $151,500 | $12,691 | $138,809 |
| 2012 | -- | $7,552 | $1,041 | $6,511 |
Source: Public Records
Map
Nearby Homes