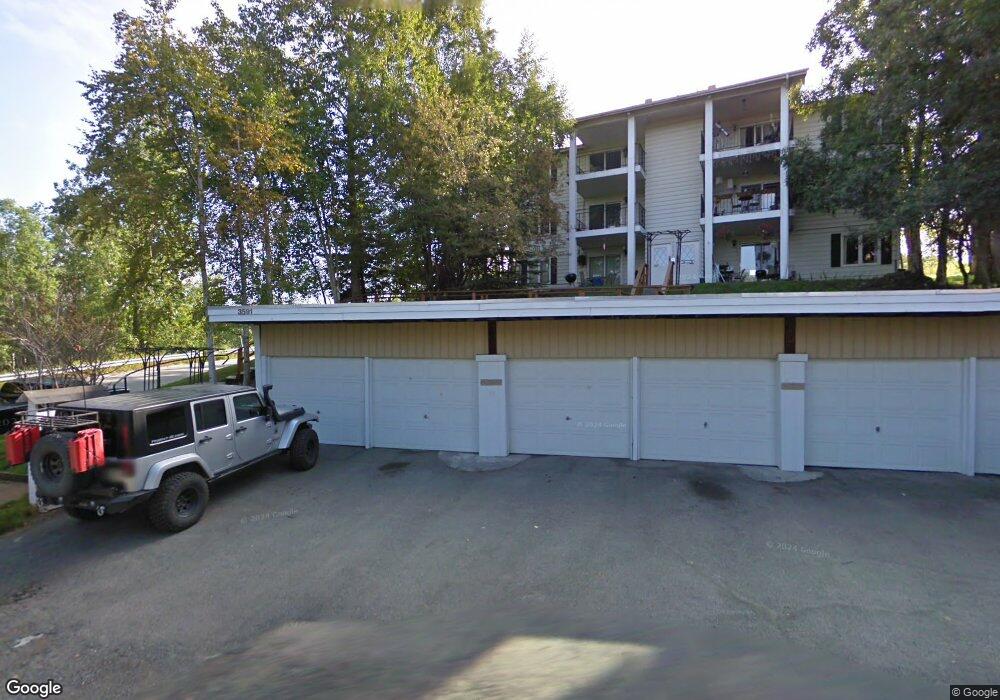
3591 Lynn Dr Unit 3 Anchorage, AK 99508
University Area NeighborhoodEstimated Value: $162,000 - $187,982
2
Beds
1
Bath
877
Sq Ft
$198/Sq Ft
Est. Value
About This Home
This home is located at 3591 Lynn Dr Unit 3, Anchorage, AK 99508 and is currently estimated at $173,994, approximately $198 per square foot. 3591 Lynn Dr Unit 3 is a home located in Anchorage Municipality with nearby schools including College Gate Elementary School, Wendler Middle School, and Bettye Davis East Anchorage High School.
Ownership History
Date
Name
Owned For
Owner Type
Purchase Details
Closed on
Sep 14, 2009
Sold by
Wiley Marjory
Bought by
Stephens Andrew P
Current Estimated Value
Home Financials for this Owner
Home Financials are based on the most recent Mortgage that was taken out on this home.
Original Mortgage
$119,000
Outstanding Balance
$77,747
Interest Rate
5.25%
Mortgage Type
Seller Take Back
Estimated Equity
$96,247
Purchase Details
Closed on
Jun 8, 2009
Sold by
Wiley Lela A
Bought by
Wiley Marjory
Purchase Details
Closed on
May 30, 2002
Sold by
Pival Frank G
Bought by
Morton Marlo and Morton Michele
Purchase Details
Closed on
May 26, 1993
Sold by
Pival Frank G
Bought by
Pival Frank G and Cartwright Elizabeth Ann
Home Financials for this Owner
Home Financials are based on the most recent Mortgage that was taken out on this home.
Original Mortgage
$68,900
Interest Rate
7.5%
Mortgage Type
New Conventional
Create a Home Valuation Report for This Property
The Home Valuation Report is an in-depth analysis detailing your home's value as well as a comparison with similar homes in the area
Home Values in the Area
Average Home Value in this Area
Purchase History
| Date | Buyer | Sale Price | Title Company |
|---|---|---|---|
| Stephens Andrew P | -- | Pnt | |
| Wiley Marjory | -- | Pacific Northwest Title Of A | |
| Morton Marlo | -- | -- | |
| Pival Frank G | -- | -- | |
| Pival Frank G | -- | -- | |
| Pival Frank G | -- | -- |
Source: Public Records
Mortgage History
| Date | Status | Borrower | Loan Amount |
|---|---|---|---|
| Open | Stephens Andrew P | $119,000 | |
| Previous Owner | Pival Frank G | $68,900 |
Source: Public Records
Tax History
| Year | Tax Paid | Tax Assessment Tax Assessment Total Assessment is a certain percentage of the fair market value that is determined by local assessors to be the total taxable value of land and additions on the property. | Land | Improvement |
|---|---|---|---|---|
| 2025 | $1,733 | $167,300 | -- | $167,300 |
| 2024 | $1,733 | $178,900 | $0 | $178,900 |
| 2023 | $1,804 | $166,800 | $0 | $166,800 |
| 2022 | $2,091 | $155,200 | $0 | $155,200 |
| 2021 | $2,389 | $132,600 | $0 | $132,600 |
| 2020 | $1,888 | $139,000 | $0 | $139,000 |
| 2019 | $1,712 | $130,800 | $0 | $130,800 |
| 2018 | $1,707 | $130,100 | $0 | $130,100 |
| 2017 | $1,670 | $118,500 | $0 | $118,500 |
| 2016 | $1,626 | $117,800 | $0 | $117,800 |
| 2015 | $1,626 | $115,800 | $0 | $115,800 |
| 2014 | $1,626 | $120,700 | $0 | $120,700 |
Source: Public Records
Map
Nearby Homes
- 3668 Little Bear Place Unit 6
- 5561 Big Bear Way Unit 25
- 4109 Lynn Dr Unit 214
- 4109 Lynn Dr Unit 212
- 4109 Lynn Dr Unit 101
- 3209 Eastgate Place Unit 104
- 5632 E 40th Ave Unit E201
- 5240 E 42nd Ave
- 3973 Defiance St
- L1 Whisper Hill Cir
- 000 Wesleyan Dr
- 6251 E 41st Ct Unit 6251
- 4768 Mills Dr Unit 42
- 4856 Bryn Mawr Ct Unit 3
- 4711 Mills Dr Unit 101
- 4839 Bryn Mawr Ct Unit 5
- 6307 Regent Dr
- 5013 Marlowe Ave
- 2601 Palmer Ct Unit D4
- 3121 Rosella St Unit D
- 3591 Lynn Dr Unit 6
- 3591 Lynn Dr Unit 5
- 3591 Lynn Dr Unit 4
- 3591 Lynn Dr Unit 2
- 3591 Lynn Dr Unit 1
- 3591 Boniface Pkwy
- 3630 Boniface Pkwy
- 3630 Boniface Pkwy
- 3601 Lynn Dr
- 3623 Lynn Dr
- 3634 Boniface Pkwy
- 3634 Boniface Pkwy Unit 3
- 5394 Sillary Cir
- 5386 Sillary Cir
- 3637 Lynn Dr
- 3672 Boniface Pkwy
- L3 B4 Lynn Dr
- 5373 Sillary Cir
- 3674 Little Bear Place Unit 7
- 3680 Little Bear Place Unit 8