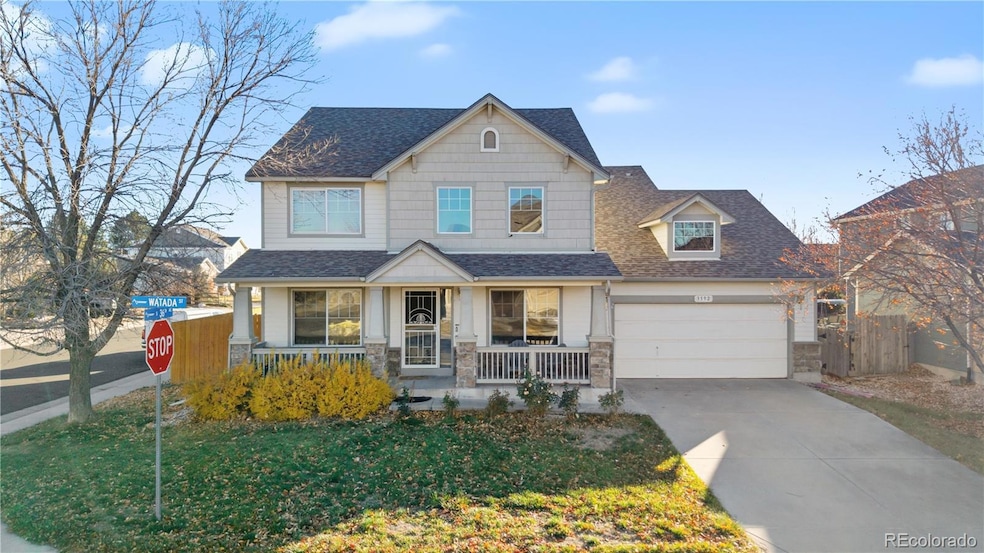
3592 Watada St Brighton, CO 80601
Estimated payment $3,150/month
Highlights
- Primary Bedroom Suite
- Den
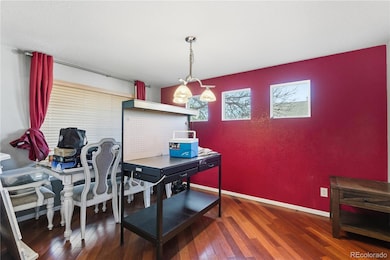
- Living Room
- Brookside Rated A-
- 3 Car Attached Garage
- Laundry Room
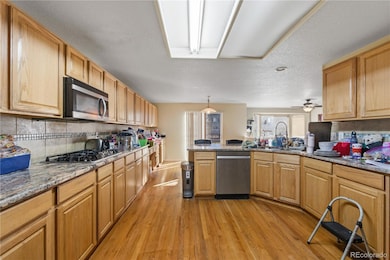
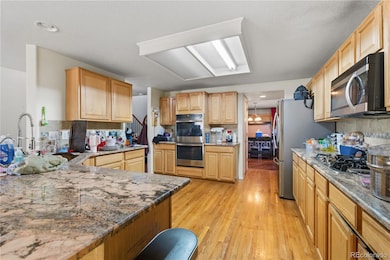
About This Home
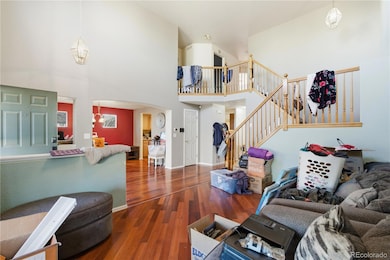
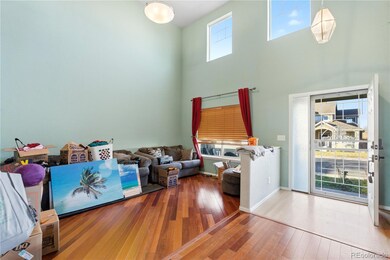
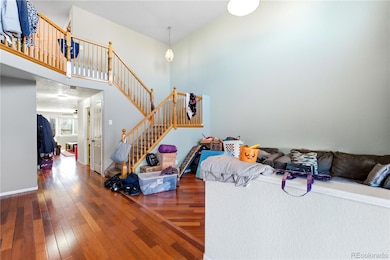
This 5-bedroom, 3 bath home offers solid space, a great layout, and a price that’s ready to move. The main level features a kitchen in great shape, with plenty of room to cook and gather. The living and dining areas flow comfortably and give you a strong foundation to update, personalize, or make your own over time. With five bedrooms and extra finished space in the basement, the home provides flexibility for guests, offices, workouts, or additional storage, a huge perk at this price point. Outside, you’ll appreciate the large backyard, perfect for simple outdoor living now and full of potential for whatever you envision down the road. If you’re looking for space, value, and a home you can put your own touches on, this one is a great opportunity.
Listing Agent
LPT Realty Brokerage Email: janel@thebairdteam.net,303-915-5068 License #100081821 Listed on: 11/26/2025

Home Details
Home Type
- Single Family
Est. Annual Taxes
- $4,305
Year Built
- Built in 2003
Lot Details
- 8,746 Sq Ft Lot
Parking
- 3 Car Attached Garage
Home Design
- Frame Construction
- Composition Roof
- Stone Siding
Interior Spaces
- 2-Story Property
- Family Room
- Living Room
- Dining Room
- Den
- Finished Basement
Kitchen
- Range
- Microwave
- Dishwasher
- Disposal
Bedrooms and Bathrooms
- Primary Bedroom Suite
- En-Suite Bathroom
Laundry
- Laundry Room
- Dryer
- Washer
Schools
- Mary E Pennock Elementary School
- Overland Trail Middle School
- Brighton High School
Utilities
- Forced Air Heating and Cooling System
- Heating System Uses Natural Gas
Community Details
- Property has a Home Owners Association
- Hammersmith Association, Phone Number (303) 980-0700
- Sugar Creek Subdivision
Listing and Financial Details
- Exclusions: Seller's Personal Property
- Assessor Parcel Number R0145983
Map
Home Values in the Area
Average Home Value in this Area
Tax History
| Year | Tax Paid | Tax Assessment Tax Assessment Total Assessment is a certain percentage of the fair market value that is determined by local assessors to be the total taxable value of land and additions on the property. | Land | Improvement |
|---|---|---|---|---|
| 2024 | $4,305 | $36,510 | $6,880 | $29,630 |
| 2023 | $4,280 | $42,280 | $6,900 | $35,380 |
| 2022 | $3,324 | $29,970 | $7,090 | $22,880 |
| 2021 | $3,128 | $29,970 | $7,090 | $22,880 |
| 2020 | $2,990 | $29,930 | $7,290 | $22,640 |
| 2019 | $2,997 | $29,930 | $7,290 | $22,640 |
| 2018 | $2,675 | $26,640 | $6,120 | $20,520 |
| 2017 | $2,679 | $26,640 | $6,120 | $20,520 |
| 2016 | $2,301 | $22,760 | $4,140 | $18,620 |
| 2015 | $2,286 | $22,760 | $4,140 | $18,620 |
| 2014 | -- | $19,980 | $3,580 | $16,400 |
Property History
| Date | Event | Price | List to Sale | Price per Sq Ft |
|---|---|---|---|---|
| 11/30/2025 11/30/25 | Pending | -- | -- | -- |
| 11/26/2025 11/26/25 | For Sale | $530,000 | -- | $163 / Sq Ft |
Purchase History
| Date | Type | Sale Price | Title Company |
|---|---|---|---|
| Warranty Deed | $425,000 | Equity Title Of Colorado | |
| Interfamily Deed Transfer | -- | None Available | |
| Warranty Deed | $265,000 | Land Title Guarantee Company |
Mortgage History
| Date | Status | Loan Amount | Loan Type |
|---|---|---|---|
| Open | $417,302 | FHA | |
| Previous Owner | $258,282 | FHA |
Source: REcolorado®
MLS Number: 5786285
APN: 1569-09-3-09-025
Disclaimer: Certain information contained herein is derived from information provided by parties other than Homes.com. All information provided is deemed reliable, but is not guaranteed to be accurate and should be independently verified.
![]() The content relating to real estate for sale in this Web site comes in part from the Internet Data eXchange (“IDX”) program of METROLIST, INC., DBA RECOLORADO®. Real estate listings held by brokers other than Ten-X are marked with the IDX Logo. This information is being provided for the consumers’ personal, non-commercial use and may not be used for any other purpose. All information subject to change and should be independently verified.
The content relating to real estate for sale in this Web site comes in part from the Internet Data eXchange (“IDX”) program of METROLIST, INC., DBA RECOLORADO®. Real estate listings held by brokers other than Ten-X are marked with the IDX Logo. This information is being provided for the consumers’ personal, non-commercial use and may not be used for any other purpose. All information subject to change and should be independently verified.
This publication is designed to provide information with regard to the subject matter covered. It is displayed with the understanding that the publisher and authors are not engaged in rendering real estate, legal, accounting, tax, or other professional services and that the publisher and authors are not offering such advice in this publication. If real estate, legal, or other expert assistance is required, the services of a competent, professional person should be sought.
The information contained in this publication is subject to change without notice. METROLIST, INC., DBA RECOLORADO MAKES NO WARRANTY OF ANY KIND WITH REGARD TO THIS MATERIAL, INCLUDING, BUT NOT LIMITED TO, THE IMPLIED WARRANTIES OF MERCHANTABILITY AND FITNESS FOR A PARTICULAR PURPOSE. METROLIST, INC., DBA RECOLORADO SHALL NOT BE LIABLE FOR ERRORS CONTAINED HEREIN OR FOR ANY DAMAGES IN CONNECTION WITH THE FURNISHING, PERFORMANCE, OR USE OF THIS MATERIAL.
PUBLISHER’S NOTICE: All real estate advertised herein is subject to the Federal Fair Housing Act and the Colorado Fair Housing Act, which Acts make it illegal to make or publish any advertisement that indicates any preference, limitation, or discrimination based on race, color, religion, sex, handicap, familial status, or national origin.
METROLIST, INC., DBA RECOLORADO will not knowingly accept any advertising for real estate that is in violation of the law. All persons are hereby informed that all dwellings advertised are available on an equal opportunity basis.
© 2025 METROLIST, INC., DBA RECOLORADO® – All Rights Reserved. 6455 S. Yosemite St., Suite 500 Greenwood Village, CO 80111 USA
ALL RIGHTS RESERVED WORLDWIDE. No part of this publication may be reproduced, adapted, translated, stored in a retrieval system or transmitted in any form or by any means, electronic, mechanical, photocopying, recording, or otherwise, without the prior written permission of the publisher. The information contained herein including but not limited to all text, photographs, digital images, virtual tours, may be seeded and monitored for protection and tracking.
- 476 S 35th Ct
- 571 Rio Rancho Way
- 2900 Purcell St Unit O-4
- 2900 Purcell St Unit I-3
- 2900 Purcell St Unit D-1
- 326 S 33rd Ave
- 334 Octillo St
- 356 Monte Vista St
- 220 Terra Vista St
- 321 S 26th Ave
- 3060 E Bridge St Unit 38
- 3060 E Bridge St Unit 159
- 3060 E Bridge St Unit 213
- 3060 E Bridge St Unit 303
- 3060 E Bridge St Unit 109
- 3060 E Bridge St
- 465 S 24th Ave
- 618 Box Elder Creek Dr
- 551 Longhurst Place
- 2277 Wingler Place