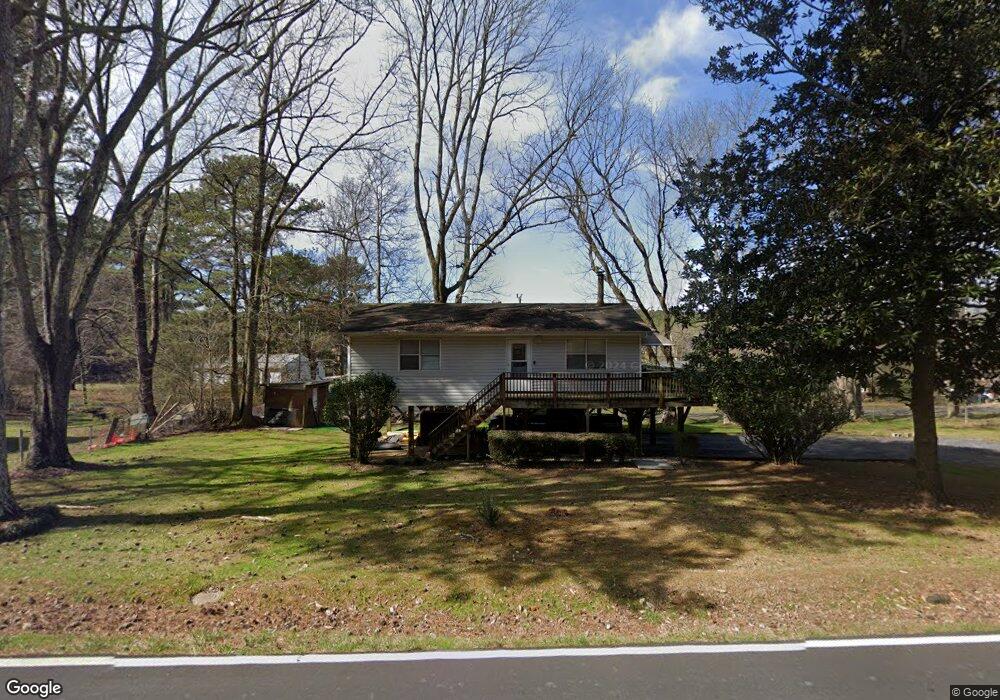
3593 Lake Kathy Rd Tunnel Hill, GA 30755
Estimated Value: $197,000 - $274,000
2
Beds
1
Bath
912
Sq Ft
$257/Sq Ft
Est. Value
About This Home
This home is located at 3593 Lake Kathy Rd, Tunnel Hill, GA 30755 and is currently estimated at $234,333, approximately $256 per square foot. 3593 Lake Kathy Rd is a home located in Whitfield County with nearby schools including New Hope Elementary School, New Hope Middle School, and Northwest Whitfield County High School.
Ownership History
Date
Name
Owned For
Owner Type
Purchase Details
Closed on
Sep 29, 2010
Sold by
Secretary Of Housing
Bought by
Roberts Lloyd
Current Estimated Value
Purchase Details
Closed on
Apr 13, 2007
Sold by
Salyer Scott
Bought by
Watkins Samuel David
Home Financials for this Owner
Home Financials are based on the most recent Mortgage that was taken out on this home.
Original Mortgage
$80,240
Interest Rate
6.1%
Mortgage Type
New Conventional
Purchase Details
Closed on
Jul 14, 2006
Sold by
Not Provided
Bought by
Roberts Lloyd
Home Financials for this Owner
Home Financials are based on the most recent Mortgage that was taken out on this home.
Original Mortgage
$68,820
Interest Rate
6.6%
Mortgage Type
New Conventional
Purchase Details
Closed on
Oct 1, 2001
Sold by
Fry John Barnum
Bought by
Fry Frank Barnum
Purchase Details
Closed on
May 1, 1994
Bought by
Fry John Barnum
Create a Home Valuation Report for This Property
The Home Valuation Report is an in-depth analysis detailing your home's value as well as a comparison with similar homes in the area
Home Values in the Area
Average Home Value in this Area
Purchase History
| Date | Buyer | Sale Price | Title Company |
|---|---|---|---|
| Roberts Lloyd | $31,060 | -- | |
| Watkins Samuel David | $81,500 | -- | |
| Roberts Lloyd | $69,900 | -- | |
| Fry Frank Barnum | -- | -- | |
| Fry John Barnum | $47,500 | -- |
Source: Public Records
Mortgage History
| Date | Status | Borrower | Loan Amount |
|---|---|---|---|
| Previous Owner | Watkins Samuel David | $80,240 | |
| Previous Owner | Roberts Lloyd | $68,820 |
Source: Public Records
Tax History Compared to Growth
Tax History
| Year | Tax Paid | Tax Assessment Tax Assessment Total Assessment is a certain percentage of the fair market value that is determined by local assessors to be the total taxable value of land and additions on the property. | Land | Improvement |
|---|---|---|---|---|
| 2024 | $794 | $50,299 | $7,600 | $42,699 |
| 2023 | $794 | $26,425 | $5,700 | $20,725 |
| 2022 | $571 | $19,348 | $3,990 | $15,358 |
| 2021 | $571 | $19,348 | $3,990 | $15,358 |
| 2020 | $586 | $19,216 | $3,990 | $15,226 |
| 2019 | $596 | $19,216 | $3,990 | $15,226 |
| 2018 | $605 | $19,216 | $3,990 | $15,226 |
| 2017 | $606 | $19,216 | $3,990 | $15,226 |
| 2016 | $541 | $17,838 | $3,990 | $13,848 |
| 2014 | $681 | $25,309 | $4,200 | $21,109 |
| 2013 | -- | $25,309 | $4,200 | $21,109 |
Source: Public Records
Map
Nearby Homes
- 1350 Peggy Ln
- 1352 Peggy Ln
- 1346 Peggy Ln
- 13701372 Peggy Ln
- 13461372 Peggy Ln
- 1360 Peggy Ln
- 1370 &1372 Peggy Ln
- 1370 Peggy Ln Unit s A & B
- 0 Crabtree Dr Unit 130058
- 716 Bull Run Dr
- 0 Colston Ln Unit 130297
- 117 Shadowrock Dr
- 212 Yardley Ln
- 831 Tunnel Hill Rd
- Lot 54 Wexford Place
- 1149 Percheron Dr NW
- 0 Cooper Rd Unit 1522624
- 0 Cooper Rd Unit 131107
- 1822 Tunnel Hill Varnell Rd
- 13 Ac Percheron Dr NW
- 3602 Lake Kathy Rd
- 3613 Lake Kathy Rd
- 3591 Lake Kathy Rd
- 3594 Lake Kathy Rd
- 3641 Susan Ln
- 3639 Susan Ln
- 3588 Lake Kathy Rd
- 3571 Lake Kathy Rd
- 3647 Susan Ln
- 3637 Susan Ln
- 3649 Susan Ln
- 3614 Lake Kathy Rd
- 3569 Lake Kathy Rd
- 3572 Lake Kathy Rd
- 3631 Susan Ln
- 3619 Lake Kathy Rd
- 3625 Susan Ln
- 3559 Lake Kathy Rd
- 3619 Susan Ln
- 3617 Susan Ln