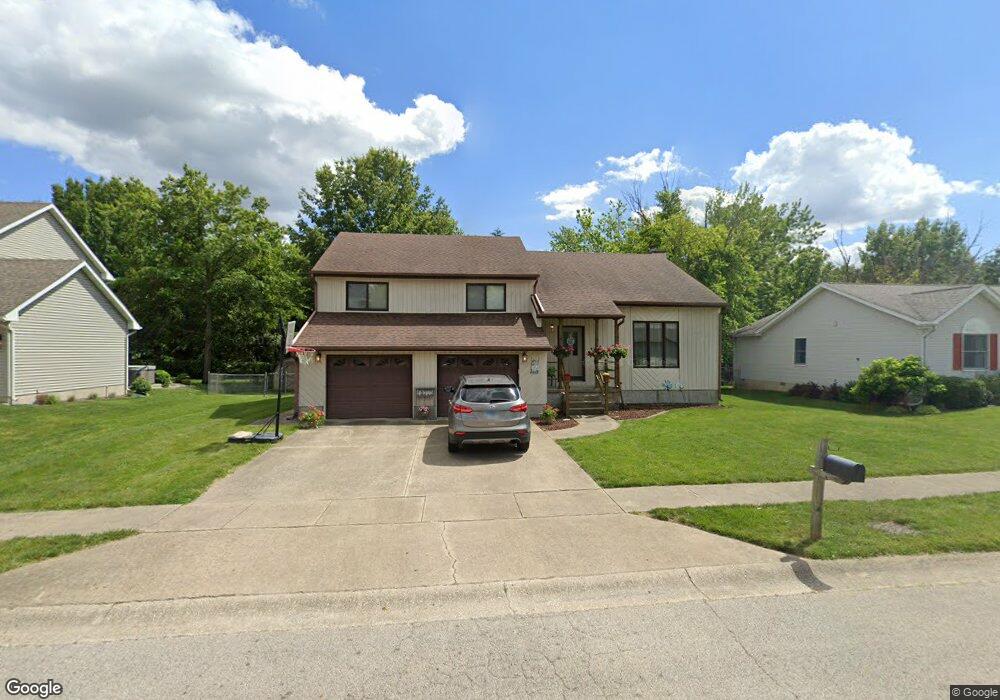
3595 Redlich Dr Decatur, IL 62521
Greenlake NeighborhoodEstimated Value: $180,000 - $203,731
5
Beds
3
Baths
2,320
Sq Ft
$83/Sq Ft
Est. Value
About This Home
This home is located at 3595 Redlich Dr, Decatur, IL 62521 and is currently estimated at $192,433, approximately $82 per square foot. 3595 Redlich Dr is a home located in Macon County with nearby schools including McGaughey Elementary School, Mt. Zion Elementary School, and Mt. Zion Intermediate School.
Ownership History
Date
Name
Owned For
Owner Type
Purchase Details
Closed on
Apr 24, 2013
Sold by
Fyke David B
Bought by
Fyke Gail L
Current Estimated Value
Home Financials for this Owner
Home Financials are based on the most recent Mortgage that was taken out on this home.
Original Mortgage
$125,450
Outstanding Balance
$88,229
Interest Rate
3.39%
Mortgage Type
New Conventional
Estimated Equity
$104,204
Purchase Details
Closed on
Oct 5, 2006
Sold by
Landamerica One Stop Inc
Bought by
Fyke David B and Fyke Gail L
Home Financials for this Owner
Home Financials are based on the most recent Mortgage that was taken out on this home.
Original Mortgage
$110,400
Interest Rate
6.45%
Mortgage Type
New Conventional
Purchase Details
Closed on
Jul 19, 2006
Sold by
Hu Jimmy J
Bought by
Landamerican One Stop Inc
Home Financials for this Owner
Home Financials are based on the most recent Mortgage that was taken out on this home.
Original Mortgage
$23,450
Interest Rate
6.5%
Mortgage Type
Future Advance Clause Open End Mortgage
Purchase Details
Closed on
Jul 1, 1996
Create a Home Valuation Report for This Property
The Home Valuation Report is an in-depth analysis detailing your home's value as well as a comparison with similar homes in the area
Home Values in the Area
Average Home Value in this Area
Purchase History
| Date | Buyer | Sale Price | Title Company |
|---|---|---|---|
| Fyke Gail L | -- | None Available | |
| Fyke David B | $138,000 | None Available | |
| Landamerican One Stop Inc | $138,000 | None Available | |
| -- | $119,000 | -- |
Source: Public Records
Mortgage History
| Date | Status | Borrower | Loan Amount |
|---|---|---|---|
| Open | Fyke Gail L | $125,450 | |
| Closed | Fyke David B | $110,400 | |
| Previous Owner | Landamerican One Stop Inc | $23,450 |
Source: Public Records
Tax History Compared to Growth
Tax History
| Year | Tax Paid | Tax Assessment Tax Assessment Total Assessment is a certain percentage of the fair market value that is determined by local assessors to be the total taxable value of land and additions on the property. | Land | Improvement |
|---|---|---|---|---|
| 2024 | $5,339 | $59,089 | $6,980 | $52,109 |
| 2023 | $5,150 | $54,905 | $6,486 | $48,419 |
| 2022 | $4,909 | $51,624 | $6,098 | $45,526 |
| 2021 | $4,796 | $48,941 | $5,781 | $43,160 |
| 2020 | $4,643 | $46,774 | $5,525 | $41,249 |
| 2019 | $4,643 | $46,774 | $5,525 | $41,249 |
| 2018 | $4,499 | $45,749 | $5,404 | $40,345 |
| 2017 | $4,464 | $45,184 | $5,337 | $39,847 |
| 2016 | $3,875 | $45,157 | $5,334 | $39,823 |
| 2015 | $3,753 | $44,578 | $5,266 | $39,312 |
| 2014 | $3,583 | $44,578 | $5,266 | $39,312 |
| 2013 | $3,600 | $44,578 | $5,266 | $39,312 |
Source: Public Records
Map
Nearby Homes
- 2554 S Nantucket Dr
- 2504 S Nantucket Dr
- 2571 Lansdowne Dr
- 2458 Quail Dr
- 2488 S Fontaine Dr
- 3405 Fontenac Ct
- 3172 Redlich Dr
- 3290 E Fitzgerald Rd
- 3210 Fields Ct
- 3552 E Orchard Dr
- 3330 S Baltimore Ave
- 1968 S Baltimore Ave
- 3109 E Cherry Dr
- 4090 S Lake Ct
- 1748 S Montrose Ave
- 1809 S 32nd St
- 3645 E Fulton Ave
- 1715 S 34th Place
- 128 Hightide Dr
- 1745 S 44th St
- 3591 Redlich Dr
- 3601 Redlich Dr
- 2575 Deerfield Ct
- 2576 Deerfield Ct
- 3587 Redlich Dr
- 2594 S Nantucket Dr
- 2575 Rachels Way
- 2575 S Rachel's Way
- 2556 Deerfield Ct
- 3585 Redlich Dr
- 2555 Deerfield Ct
- 2574 S Nantucket Dr
- 2565 Rachels Way
- 3579 Redlich Dr
- 2526 Deerfield Ct
- 2555 Rachels Way
- 2555 Rachel's Way
- 2525 Deerfield Ct
- 2573 S Nantucket Dr
- 2534 S Nantucket Dr