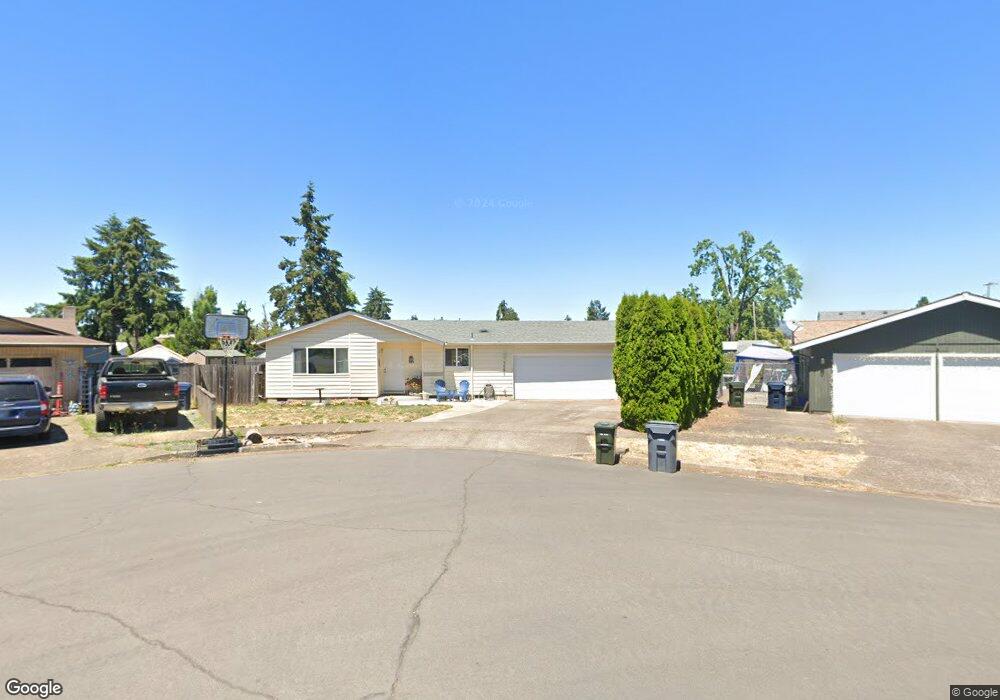
3598 S E St Springfield, OR 97478
East Springfield NeighborhoodEstimated Value: $354,000 - $378,161
3
Beds
2
Baths
1,100
Sq Ft
$335/Sq Ft
Est. Value
About This Home
This home is located at 3598 S E St, Springfield, OR 97478 and is currently estimated at $368,790, approximately $335 per square foot. 3598 S E St is a home located in Lane County with nearby schools including Douglas Gardens Elementary School, Agnes Stewart Middle School, and Springfield High School.
Ownership History
Date
Name
Owned For
Owner Type
Purchase Details
Closed on
Jan 8, 2015
Sold by
Herring Stephen E and Herring Holly Anne
Bought by
Davis Austin L
Current Estimated Value
Home Financials for this Owner
Home Financials are based on the most recent Mortgage that was taken out on this home.
Original Mortgage
$137,750
Outstanding Balance
$104,816
Interest Rate
3.82%
Mortgage Type
New Conventional
Estimated Equity
$263,974
Purchase Details
Closed on
Nov 3, 2007
Sold by
Prasad Rajendra and Prasad Vinuka
Bought by
Herring Stephen E and Herring Holly Anne
Home Financials for this Owner
Home Financials are based on the most recent Mortgage that was taken out on this home.
Original Mortgage
$114,750
Interest Rate
6.29%
Mortgage Type
Negative Amortization
Create a Home Valuation Report for This Property
The Home Valuation Report is an in-depth analysis detailing your home's value as well as a comparison with similar homes in the area
Home Values in the Area
Average Home Value in this Area
Purchase History
| Date | Buyer | Sale Price | Title Company |
|---|---|---|---|
| Davis Austin L | $145,000 | Evergreen Land Title | |
| Herring Stephen E | $153,000 | Evergreen Land Title Company |
Source: Public Records
Mortgage History
| Date | Status | Borrower | Loan Amount |
|---|---|---|---|
| Open | Davis Austin L | $137,750 | |
| Previous Owner | Herring Stephen E | $114,750 |
Source: Public Records
Tax History
| Year | Tax Paid | Tax Assessment Tax Assessment Total Assessment is a certain percentage of the fair market value that is determined by local assessors to be the total taxable value of land and additions on the property. | Land | Improvement |
|---|---|---|---|---|
| 2025 | $3,089 | $168,431 | -- | -- |
| 2024 | $3,039 | $163,526 | -- | -- |
| 2023 | $3,039 | $158,764 | $0 | $0 |
| 2022 | $2,814 | $154,140 | $0 | $0 |
| 2021 | $2,764 | $149,651 | $0 | $0 |
| 2020 | $2,683 | $145,293 | $0 | $0 |
| 2019 | $2,602 | $141,062 | $0 | $0 |
| 2018 | $2,453 | $132,965 | $0 | $0 |
| 2017 | $2,359 | $132,965 | $0 | $0 |
| 2016 | $2,309 | $129,092 | $0 | $0 |
| 2015 | $2,243 | $125,332 | $0 | $0 |
| 2014 | $2,210 | $121,682 | $0 | $0 |
Source: Public Records
Map
Nearby Homes
- 3720 Virginia Ave
- 455 S 38th St
- 3503 Oregon Ave
- 922 S 38th St
- 154 37th St
- 0 Filbert Ln
- 4131 Forsythia St
- 1147 S 34th Place
- 463 35th St
- 351 40th St
- 4324 Forsythia St
- 3800 E St
- 3716 E St
- 875 S 43rd St
- 934 S 46th St
- 4635 Daisy St
- 300 21st St
- 4685 Glacier Meadows Loop
- 4733 Union Terrace
- 766 S 47th Place
Your Personal Tour Guide
Ask me questions while you tour the home.