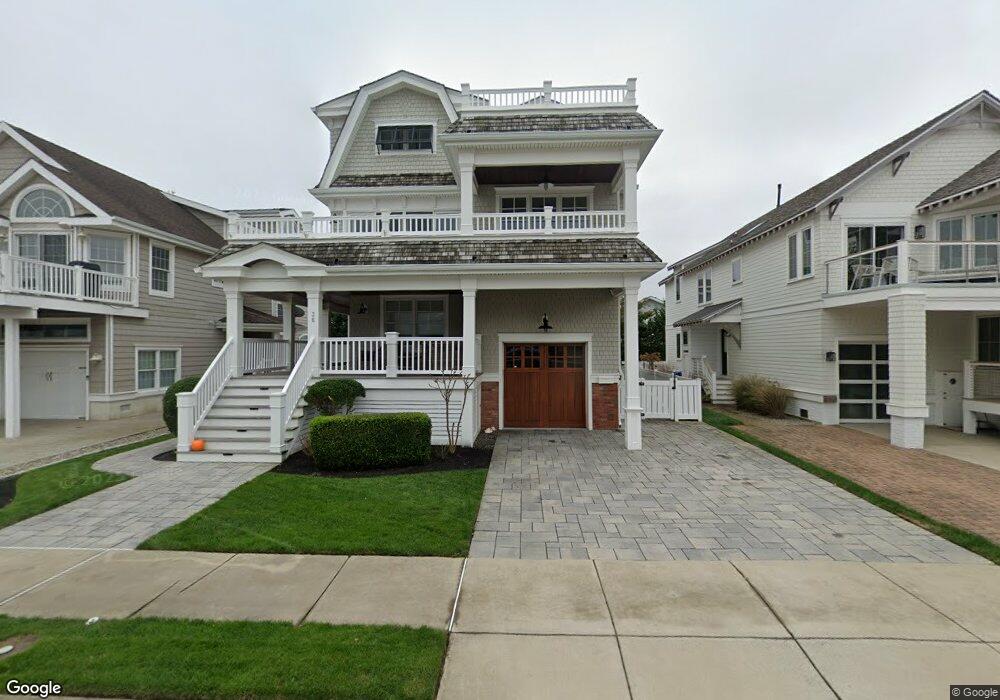
36 15th St E Avalon, NJ 08202
Estimated Value: $5,165,000 - $6,299,732
Studio
--
Bath
3,662
Sq Ft
$1,559/Sq Ft
Est. Value
About This Home
This home is located at 36 15th St E, Avalon, NJ 08202 and is currently estimated at $5,709,933, approximately $1,559 per square foot. 36 15th St E is a home located in Cape May County with nearby schools including Avalon Elementary School.
Ownership History
Date
Name
Owned For
Owner Type
Purchase Details
Closed on
Sep 18, 2025
Sold by
Adams Matthew J and Adams Michele D
Bought by
Matthew And Michele Adams Living Trust and Adams
Current Estimated Value
Purchase Details
Closed on
Nov 10, 2016
Sold by
Welsh Thomas J
Bought by
Adams Matthew J and Adams Michele D
Home Financials for this Owner
Home Financials are based on the most recent Mortgage that was taken out on this home.
Original Mortgage
$2,096,500
Interest Rate
2.5%
Mortgage Type
New Conventional
Purchase Details
Closed on
Sep 23, 2015
Sold by
Ifert Karl and Ifert Anne B
Bought by
Welsh Thomas J
Purchase Details
Closed on
Oct 2, 1986
Bought by
Ifert Karl and Ifert Anne B
Create a Home Valuation Report for This Property
The Home Valuation Report is an in-depth analysis detailing your home's value as well as a comparison with similar homes in the area
Home Values in the Area
Average Home Value in this Area
Purchase History
| Date | Buyer | Sale Price | Title Company |
|---|---|---|---|
| Matthew And Michele Adams Living Trust | -- | None Listed On Document | |
| Adams Matthew J | $2,995,000 | Fidelity National Title | |
| Welsh Thomas J | $1,600,000 | Seaboard Title Agency | |
| Ifert Karl | $305,000 | -- |
Source: Public Records
Mortgage History
| Date | Status | Borrower | Loan Amount |
|---|---|---|---|
| Previous Owner | Adams Matthew J | $2,096,500 |
Source: Public Records
Tax History
| Year | Tax Paid | Tax Assessment Tax Assessment Total Assessment is a certain percentage of the fair market value that is determined by local assessors to be the total taxable value of land and additions on the property. | Land | Improvement |
|---|---|---|---|---|
| 2025 | $17,782 | $2,896,100 | $1,700,000 | $1,196,100 |
| 2024 | $17,782 | $2,896,100 | $1,700,000 | $1,196,100 |
| 2023 | $17,637 | $2,896,100 | $1,700,000 | $1,196,100 |
| 2022 | $15,842 | $2,896,100 | $1,700,000 | $1,196,100 |
| 2021 | $15,842 | $2,896,100 | $1,700,000 | $1,196,100 |
| 2020 | $15,233 | $2,896,100 | $1,700,000 | $1,196,100 |
| 2019 | $14,770 | $2,896,100 | $1,700,000 | $1,196,100 |
| 2018 | $14,133 | $2,896,100 | $1,700,000 | $1,196,100 |
| 2017 | $13,406 | $2,411,100 | $1,400,000 | $1,011,100 |
| 2016 | $7,700 | $1,400,000 | $1,400,000 | $0 |
| 2015 | $8,995 | $1,662,700 | $1,400,000 | $262,700 |
| 2014 | $8,895 | $1,662,700 | $1,400,000 | $262,700 |
Source: Public Records
Map
Nearby Homes
Your Personal Tour Guide
Ask me questions while you tour the home.