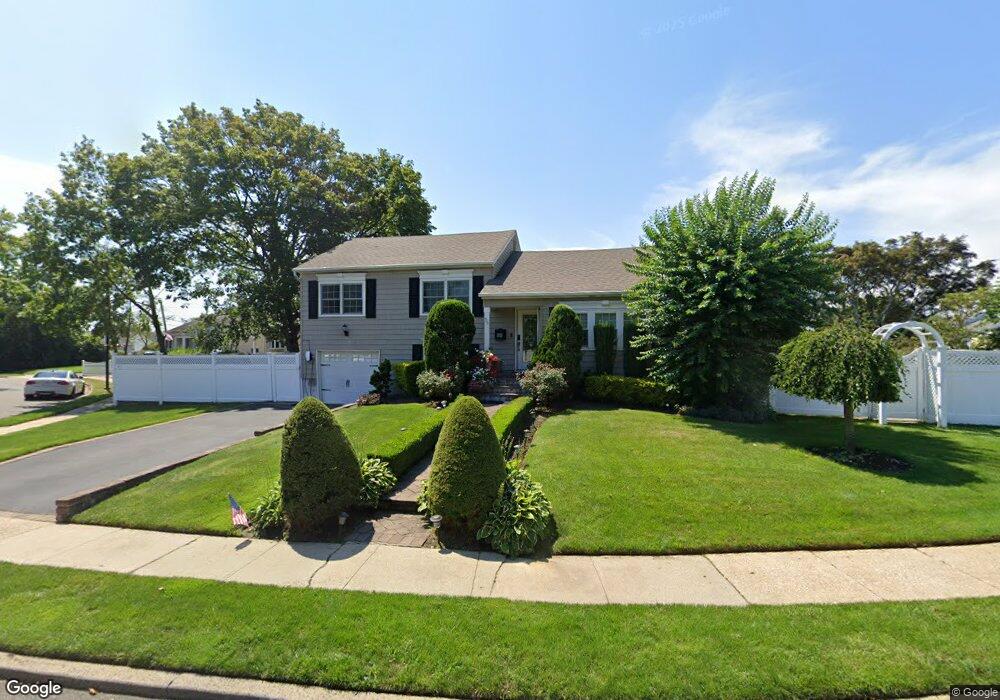
36 Acme Ave Bethpage, NY 11714
Estimated Value: $803,000 - $920,000
Studio
3
Baths
1,149
Sq Ft
$753/Sq Ft
Est. Value
About This Home
This home is located at 36 Acme Ave, Bethpage, NY 11714 and is currently estimated at $865,161, approximately $752 per square foot. 36 Acme Ave is a home located in Nassau County with nearby schools including Central Boulevard Elementary School, John F Kennedy Middle School, and Bethpage Senior High School.
Ownership History
Date
Name
Owned For
Owner Type
Purchase Details
Closed on
Jul 13, 2018
Sold by
Meyer Harry J and Cucchiara Bettina A
Bought by
Khan Ahsan and Khan Rana A
Current Estimated Value
Home Financials for this Owner
Home Financials are based on the most recent Mortgage that was taken out on this home.
Original Mortgage
$513,000
Outstanding Balance
$440,842
Interest Rate
4.5%
Mortgage Type
New Conventional
Estimated Equity
$424,319
Purchase Details
Closed on
Jul 7, 2011
Sold by
V & C Development Property Inc
Bought by
Meyer Harry J and Cucchiara Bettina A
Home Financials for this Owner
Home Financials are based on the most recent Mortgage that was taken out on this home.
Original Mortgage
$352,000
Interest Rate
4.49%
Mortgage Type
Purchase Money Mortgage
Create a Home Valuation Report for This Property
The Home Valuation Report is an in-depth analysis detailing your home's value as well as a comparison with similar homes in the area
Home Values in the Area
Average Home Value in this Area
Purchase History
| Date | Buyer | Sale Price | Title Company |
|---|---|---|---|
| Khan Ahsan | $570,000 | None Available | |
| Khan Ahsan | $570,000 | None Available | |
| Khan Ahsan | $570,000 | None Available | |
| Meyer Harry J | $440,000 | -- | |
| Meyer Harry J | $440,000 | -- | |
| Meyer Harry J | $440,000 | -- | |
| Meyer Harry J | $440,000 | -- |
Source: Public Records
Mortgage History
| Date | Status | Borrower | Loan Amount |
|---|---|---|---|
| Open | Khan Ahsan | $513,000 | |
| Closed | Khan Ahsan | $513,000 | |
| Previous Owner | Meyer Harry J | $352,000 |
Source: Public Records
Tax History
| Year | Tax Paid | Tax Assessment Tax Assessment Total Assessment is a certain percentage of the fair market value that is determined by local assessors to be the total taxable value of land and additions on the property. | Land | Improvement |
|---|---|---|---|---|
| 2025 | $14,991 | $518 | $261 | $257 |
| 2024 | $5,271 | $494 | $249 | $245 |
Source: Public Records
Map
Nearby Homes
- 38 Bradford Ln
- 4030 Avoca Ave
- 14 Hoover Ln
- 12 E Millpage Dr
- 17 Wilson Ln
- 5 Scherer St
- 59 Lincoln Blvd
- 94 Harrison Ave
- 120 Brenner Ave
- 106 Harrison Ave
- 15 N Butehorn St
- 3 Chapin Rd
- 18 Cambridge Ave
- 180 N Wantagh Ave
- 116 Stewart Ave Unit B
- 7 Cambridge Ave
- 3 Berryhill Ln
- 11 Berryhill Ln
- 54 S 1st St
- 4 Manchester Dr
Your Personal Tour Guide
Ask me questions while you tour the home.