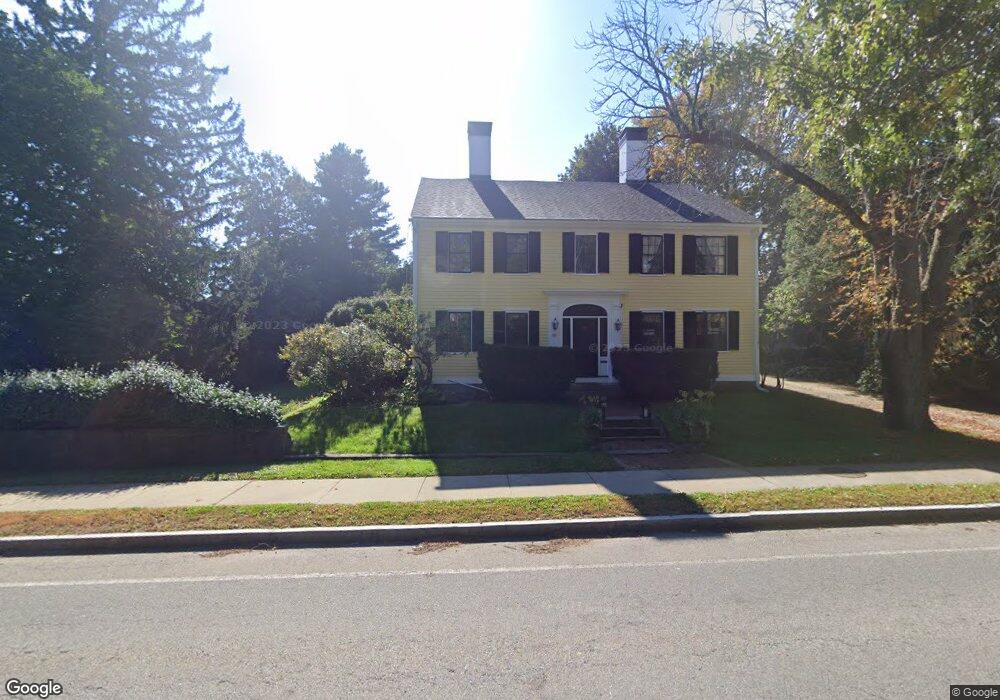
36 Andover St North Andover, MA 01845
Estimated Value: $1,217,000 - $1,355,000
5
Beds
3
Baths
3,699
Sq Ft
$349/Sq Ft
Est. Value
About This Home
This home is located at 36 Andover St, North Andover, MA 01845 and is currently estimated at $1,292,078, approximately $349 per square foot. 36 Andover St is a home located in Essex County with nearby schools including Franklin Elementary School, North Andover Middle School, and North Andover High School.
Ownership History
Date
Name
Owned For
Owner Type
Purchase Details
Closed on
Apr 29, 2005
Sold by
Macon Antonia Mcg and Macon Glen T
Bought by
Perry Erik
Current Estimated Value
Home Financials for this Owner
Home Financials are based on the most recent Mortgage that was taken out on this home.
Original Mortgage
$640,000
Outstanding Balance
$336,055
Interest Rate
5.95%
Mortgage Type
Purchase Money Mortgage
Estimated Equity
$956,023
Purchase Details
Closed on
Dec 1, 1998
Sold by
Avrett Eugene H
Bought by
Macon Glen T and Macon Antonia M
Create a Home Valuation Report for This Property
The Home Valuation Report is an in-depth analysis detailing your home's value as well as a comparison with similar homes in the area
Home Values in the Area
Average Home Value in this Area
Purchase History
| Date | Buyer | Sale Price | Title Company |
|---|---|---|---|
| Perry Erik | $800,000 | -- | |
| Macon Glen T | $480,000 | -- |
Source: Public Records
Mortgage History
| Date | Status | Borrower | Loan Amount |
|---|---|---|---|
| Open | Perry Erik | $640,000 | |
| Previous Owner | Macon Glen T | $592,000 | |
| Previous Owner | Macon Glen T | $49,200 |
Source: Public Records
Tax History
| Year | Tax Paid | Tax Assessment Tax Assessment Total Assessment is a certain percentage of the fair market value that is determined by local assessors to be the total taxable value of land and additions on the property. | Land | Improvement |
|---|---|---|---|---|
| 2025 | $13,997 | $1,243,100 | $419,700 | $823,400 |
| 2024 | $13,311 | $1,200,300 | $397,900 | $802,400 |
| 2023 | $12,629 | $1,031,800 | $336,000 | $695,800 |
| 2022 | $12,223 | $903,400 | $305,500 | $597,900 |
| 2021 | $11,727 | $827,600 | $277,200 | $550,400 |
| 2020 | $11,371 | $827,600 | $277,200 | $550,400 |
| 2019 | $8,868 | $661,300 | $277,200 | $384,100 |
| 2018 | $9,609 | $661,300 | $277,200 | $384,100 |
| 2017 | $9,052 | $633,900 | $217,200 | $416,700 |
| 2016 | $8,535 | $598,100 | $215,900 | $382,200 |
| 2015 | $8,528 | $592,600 | $212,300 | $380,300 |
Source: Public Records
Map
Nearby Homes
- 3 Great Pond Rd
- 86 Andover St
- 88 Johnson St
- 42 Hewitt Ave
- 8 Fernview Ave Unit 5
- 30 Fernview Ave Unit 4
- 19 Fernview Ave Unit 6
- 19 Fernview Ave Unit 5
- 124 Quail Run Rd
- 136 Quail Run Rd
- 66 Fernview Ave Unit 9
- 38 Village Green Dr Unit 77
- 70 Farrwood Ave Unit 7
- 115 Mill Pond
- 78 Edgelawn Ave Unit 7
- 27 Mill Pond
- 60 Edgelawn Ave Unit 1
- 36 Kieran Rd
- 12 Mill Pond Unit 12
- 335 Salem St
Your Personal Tour Guide
Ask me questions while you tour the home.