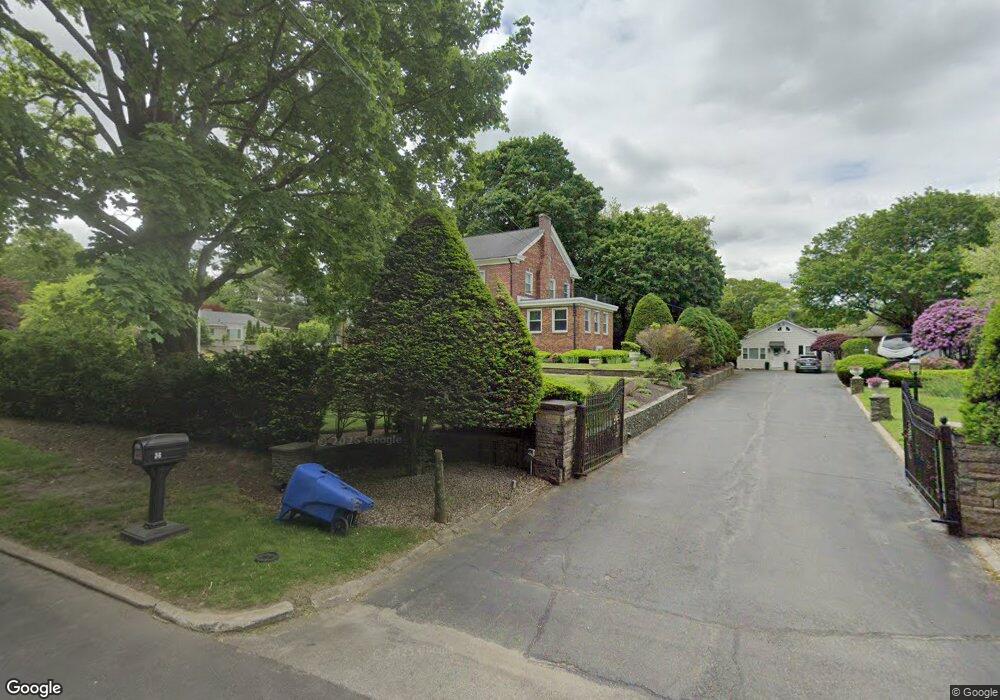
36 Ashby St Johnston, RI 02919
Thornton NeighborhoodEstimated Value: $763,000 - $889,000
5
Beds
3
Baths
5,632
Sq Ft
$147/Sq Ft
Est. Value
About This Home
This home is located at 36 Ashby St, Johnston, RI 02919 and is currently estimated at $827,072, approximately $146 per square foot. 36 Ashby St is a home located in Providence County with nearby schools including Mazomanie Elementary School, Johnston Senior High School, and Achievement First Promesa.
Ownership History
Date
Name
Owned For
Owner Type
Purchase Details
Closed on
Jun 14, 2001
Sold by
Aguanno Filomena D
Bought by
Messina Joseph J and Messina Linda M
Current Estimated Value
Home Financials for this Owner
Home Financials are based on the most recent Mortgage that was taken out on this home.
Original Mortgage
$232,000
Interest Rate
7.15%
Mortgage Type
Commercial
Create a Home Valuation Report for This Property
The Home Valuation Report is an in-depth analysis detailing your home's value as well as a comparison with similar homes in the area
Home Values in the Area
Average Home Value in this Area
Purchase History
| Date | Buyer | Sale Price | Title Company |
|---|---|---|---|
| Messina Joseph J | $290,000 | -- | |
| Messina Joseph J | $290,000 | -- |
Source: Public Records
Mortgage History
| Date | Status | Borrower | Loan Amount |
|---|---|---|---|
| Open | Messina Joseph J | $230,500 | |
| Closed | Messina Joseph J | $232,000 | |
| Closed | Messina Joseph J | $232,000 |
Source: Public Records
Tax History Compared to Growth
Tax History
| Year | Tax Paid | Tax Assessment Tax Assessment Total Assessment is a certain percentage of the fair market value that is determined by local assessors to be the total taxable value of land and additions on the property. | Land | Improvement |
|---|---|---|---|---|
| 2025 | $10,620 | $679,900 | $102,000 | $577,900 |
| 2024 | $10,402 | $679,900 | $102,000 | $577,900 |
| 2023 | $10,402 | $679,900 | $102,000 | $577,900 |
| 2022 | $13,372 | $457,000 | $79,400 | $377,600 |
| 2021 | $13,372 | $457,000 | $79,400 | $377,600 |
| 2018 | $10,388 | $377,900 | $62,300 | $315,600 |
| 2016 | $13,744 | $377,900 | $62,300 | $315,600 |
| 2015 | $9,659 | $333,200 | $65,200 | $268,000 |
| 2014 | $7,664 | $333,200 | $65,200 | $268,000 |
| 2013 | $9,580 | $333,200 | $65,200 | $268,000 |
Source: Public Records
Map
Nearby Homes
- 25 Mills Dr
- 150 Central Ave
- 8 Summit Ave
- 0 Central Ave Unit 1398155
- 0 Orchard St Unit 1396394
- 0 Orchard St Unit 1396400
- 0 Orchard St Unit 1400488
- 0 Orchard St Unit 1395201
- 28 Harrington Dr
- 0 Harding Ave
- 14 Whittlesey Rd
- 9 Orleans St
- 0 Ipswich St
- 67 Ipswich St
- 33 Harding Ave
- 776 Plainfield St
- 982 Plainfield St Unit 4
- 665 Plainfield St
- 336 Killingly St Unit D
- 259 Central Ave