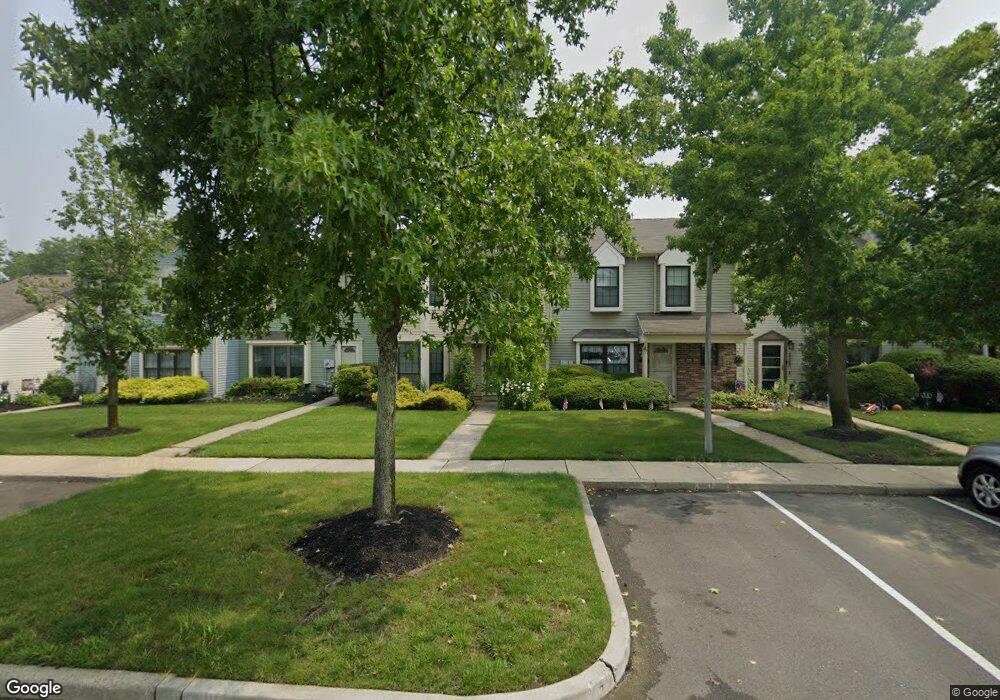
36 Banbury Ct Trenton, NJ 08691
Estimated Value: $431,000 - $504,000
3
Beds
3
Baths
1,460
Sq Ft
$316/Sq Ft
Est. Value
About This Home
This home is located at 36 Banbury Ct, Trenton, NJ 08691 and is currently estimated at $461,044, approximately $315 per square foot. 36 Banbury Ct is a home located in Mercer County with nearby schools including Sharon Elementary School, Pond Road Middle School, and Robbinsville High School.
Ownership History
Date
Name
Owned For
Owner Type
Purchase Details
Closed on
Dec 20, 2018
Sold by
Horner Jennifer and Horner Jennifer L
Bought by
Chan Siu Lung and Chan Wanting
Current Estimated Value
Purchase Details
Closed on
Aug 14, 2009
Sold by
Cannizzaro Salvatore J
Bought by
Horner Jennifer
Home Financials for this Owner
Home Financials are based on the most recent Mortgage that was taken out on this home.
Original Mortgage
$239,112
Interest Rate
5.36%
Mortgage Type
FHA
Purchase Details
Closed on
Jan 14, 2005
Sold by
Gabert Otto
Bought by
Cannizzaro Salvatore
Home Financials for this Owner
Home Financials are based on the most recent Mortgage that was taken out on this home.
Original Mortgage
$145,000
Interest Rate
5.78%
Mortgage Type
Purchase Money Mortgage
Create a Home Valuation Report for This Property
The Home Valuation Report is an in-depth analysis detailing your home's value as well as a comparison with similar homes in the area
Home Values in the Area
Average Home Value in this Area
Purchase History
| Date | Buyer | Sale Price | Title Company |
|---|---|---|---|
| Chan Siu Lung | $205,500 | None Available | |
| Horner Jennifer | $250,000 | None Available | |
| Cannizzaro Salvatore | $251,000 | -- |
Source: Public Records
Mortgage History
| Date | Status | Borrower | Loan Amount |
|---|---|---|---|
| Previous Owner | Horner Jennifer | $239,112 | |
| Previous Owner | Cannizzaro Salvatore | $145,000 |
Source: Public Records
Tax History Compared to Growth
Tax History
| Year | Tax Paid | Tax Assessment Tax Assessment Total Assessment is a certain percentage of the fair market value that is determined by local assessors to be the total taxable value of land and additions on the property. | Land | Improvement |
|---|---|---|---|---|
| 2025 | $7,596 | $227,300 | $108,200 | $119,100 |
| 2024 | $7,089 | $227,300 | $108,200 | $119,100 |
| 2023 | $7,089 | $227,300 | $108,200 | $119,100 |
| 2022 | $6,814 | $227,300 | $108,200 | $119,100 |
| 2021 | $6,717 | $227,300 | $108,200 | $119,100 |
| 2020 | $6,719 | $227,300 | $108,200 | $119,100 |
| 2019 | $6,721 | $227,300 | $108,200 | $119,100 |
| 2018 | $6,678 | $227,300 | $108,200 | $119,100 |
| 2017 | $6,664 | $227,300 | $108,200 | $119,100 |
| 2016 | $6,603 | $227,300 | $108,200 | $119,100 |
| 2015 | $6,503 | $227,300 | $108,200 | $119,100 |
| 2014 | $6,526 | $227,300 | $108,200 | $119,100 |
Source: Public Records
Map
Nearby Homes