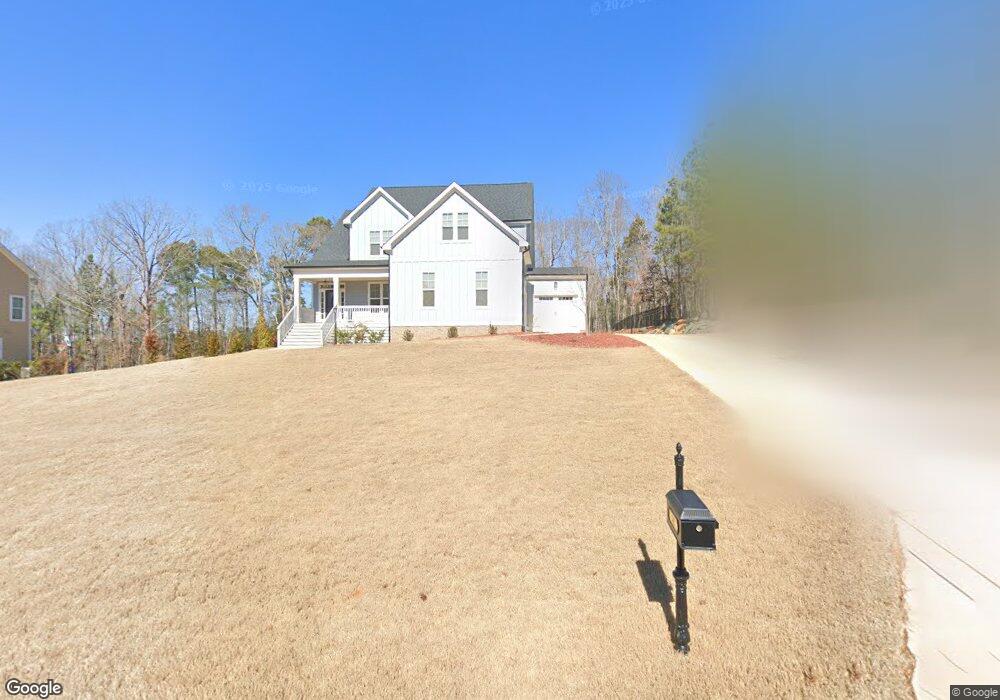
36 Bellemont Ridge Rd Unit 194 Pittsboro, NC 27312
Estimated Value: $616,000 - $786,000
5
Beds
5
Baths
3,100
Sq Ft
$233/Sq Ft
Est. Value
About This Home
This home is located at 36 Bellemont Ridge Rd Unit 194, Pittsboro, NC 27312 and is currently estimated at $722,278, approximately $232 per square foot. 36 Bellemont Ridge Rd Unit 194 is a home located in Chatham County with nearby schools including Pittsboro Elementary School, George Moses Horton Middle School, and Northwood High.
Ownership History
Date
Name
Owned For
Owner Type
Purchase Details
Closed on
Nov 3, 2022
Sold by
Lindsey James Brooks and Lindsey Laura Jane
Bought by
Blalark Frank
Current Estimated Value
Home Financials for this Owner
Home Financials are based on the most recent Mortgage that was taken out on this home.
Original Mortgage
$612,000
Outstanding Balance
$591,495
Interest Rate
6.7%
Mortgage Type
New Conventional
Estimated Equity
$130,783
Purchase Details
Closed on
Mar 18, 2022
Sold by
Triple A Homes Inc
Bought by
Lindsey James Brooks and Lindsey Laura Jane
Home Financials for this Owner
Home Financials are based on the most recent Mortgage that was taken out on this home.
Original Mortgage
$547,026
Interest Rate
4.16%
Mortgage Type
New Conventional
Purchase Details
Closed on
Mar 29, 2021
Sold by
Aq Contracting Inc
Bought by
Triple A Homes Inc
Create a Home Valuation Report for This Property
The Home Valuation Report is an in-depth analysis detailing your home's value as well as a comparison with similar homes in the area
Home Values in the Area
Average Home Value in this Area
Purchase History
| Date | Buyer | Sale Price | Title Company |
|---|---|---|---|
| Blalark Frank | $720,000 | -- | |
| Lindsey James Brooks | $588,500 | Smith Bagwell Holt | |
| Brooks Lindsey James | $588,500 | Smith Bagwell Holt | |
| Triple A Homes Inc | $100,000 | None Available | |
| Triple A Homes Inc | $100,000 | Canaday Sarah |
Source: Public Records
Mortgage History
| Date | Status | Borrower | Loan Amount |
|---|---|---|---|
| Open | Blalark Frank | $612,000 | |
| Previous Owner | Brooks Lindsey James | $547,026 |
Source: Public Records
Tax History Compared to Growth
Tax History
| Year | Tax Paid | Tax Assessment Tax Assessment Total Assessment is a certain percentage of the fair market value that is determined by local assessors to be the total taxable value of land and additions on the property. | Land | Improvement |
|---|---|---|---|---|
| 2025 | $7,021 | $651,510 | $108,743 | $542,767 |
| 2024 | $7,021 | $416,353 | $90,618 | $325,735 |
| 2023 | $5,086 | $416,353 | $90,618 | $325,735 |
| 2022 | $2,161 | $195,563 | $81,556 | $114,007 |
| 2021 | $896 | $81,556 | $81,556 | $0 |
| 2020 | $675 | $61,167 | $61,167 | $0 |
| 2019 | $675 | $61,167 | $61,167 | $0 |
| 2018 | $649 | $61,167 | $61,167 | $0 |
| 2017 | $649 | $61,167 | $61,167 | $0 |
| 2016 | $870 | $81,556 | $81,556 | $0 |
| 2015 | $861 | $81,556 | $81,556 | $0 |
| 2014 | $861 | $81,556 | $81,556 | $0 |
| 2013 | -- | $81,556 | $81,556 | $0 |
Source: Public Records
Map
Nearby Homes
- 1157 Hillsboro St
- 54 Pattishall Rd
- 116 Kensington Dr
- 186 Millennium Dr
- 142 Autumn Gate St
- 24 Cynthia Ln
- 710 Vine Pkwy
- 17 Plenty Ct
- 53 Circle City Way
- 425 Credle St
- Tbd Versailles Ln
- 11 Allgood St
- 26 Danbury Ct
- 7839 U S Highway 64
- 7837 U S Highway 64
- 7841 U S Highway 64
- 41 Cottage Way
- 230 Oakwood Dr
- 298 E Salisbury St
- 291 Wendover Pkwy
- 36 Bellemont Ridge Rd
- 64 Bellemont Ridge Rd
- 64 Bellemont Ridge Rd Unit 193
- 18 Bellemont Ridge Rd Unit 195
- 18 Bellemont Ridge Rd
- 403 Bellemont Ridge Rd
- 371 Bellemont Ridge Rd
- 70 Bellemont Ridge Rd
- 70 Bellemont Ridge Rd Unit 192
- 59 Bellemont Ridge Rd
- 59 Bellemont Ridge Rd Unit 190
- 21 Bellemont Ridge Rd
- 9 Bellemont Ridge Rd
- 9 Bellemont Ridge Rd Unit 197
- 403 Bellemont Rd
- 403 Bellemont Rd
- 403 Bellemont Rd Unit 189
- 77 Bellemont Ridge Rd
- 77 Bellemont Ridge Rd Unit 191
- 400 Bellemont Rd