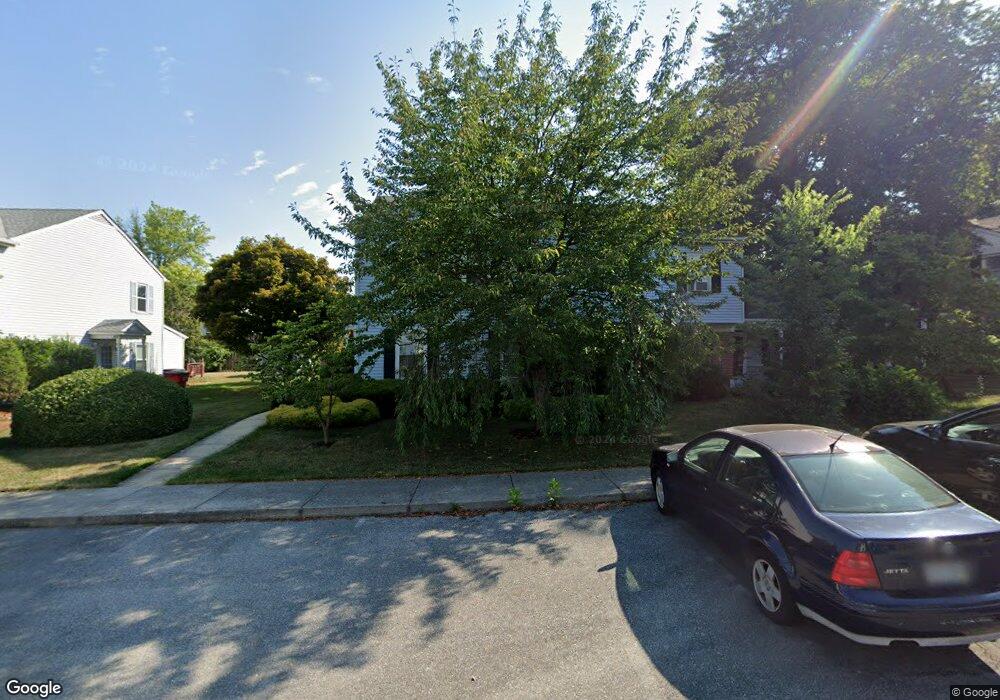
36 Berkeley Ct Charles Town, WV 25414
Estimated Value: $252,000 - $277,000
2
Beds
2
Baths
1,520
Sq Ft
$173/Sq Ft
Est. Value
About This Home
This home is located at 36 Berkeley Ct, Charles Town, WV 25414 and is currently estimated at $262,994, approximately $173 per square foot. 36 Berkeley Ct is a home located in Jefferson County with nearby schools including Page Jackson Elementary School, Wright Denny Intermediate School, and Charles Town Middle School.
Ownership History
Date
Name
Owned For
Owner Type
Purchase Details
Closed on
Sep 18, 2025
Sold by
Ruby Gail R
Bought by
Randazzo Stormy Davon and Boyd Christian Asbury
Current Estimated Value
Home Financials for this Owner
Home Financials are based on the most recent Mortgage that was taken out on this home.
Original Mortgage
$24,000
Outstanding Balance
$24,000
Interest Rate
6.63%
Estimated Equity
$238,994
Purchase Details
Closed on
Jun 15, 2007
Sold by
Walsh Doris K
Bought by
Ruby Gail R
Home Financials for this Owner
Home Financials are based on the most recent Mortgage that was taken out on this home.
Original Mortgage
$177,219
Interest Rate
6.24%
Mortgage Type
FHA
Create a Home Valuation Report for This Property
The Home Valuation Report is an in-depth analysis detailing your home's value as well as a comparison with similar homes in the area
Home Values in the Area
Average Home Value in this Area
Purchase History
| Date | Buyer | Sale Price | Title Company |
|---|---|---|---|
| Randazzo Stormy Davon | $215,000 | None Listed On Document | |
| Randazzo Stormy Davon | $215,000 | None Listed On Document | |
| Ruby Gail R | $180,000 | None Available |
Source: Public Records
Mortgage History
| Date | Status | Borrower | Loan Amount |
|---|---|---|---|
| Open | Randazzo Stormy Davon | $24,000 | |
| Closed | Randazzo Stormy Davon | $24,000 | |
| Open | Randazzo Stormy Davon | $191,000 | |
| Closed | Randazzo Stormy Davon | $191,000 | |
| Previous Owner | Ruby Gail R | $177,219 |
Source: Public Records
Tax History Compared to Growth
Tax History
| Year | Tax Paid | Tax Assessment Tax Assessment Total Assessment is a certain percentage of the fair market value that is determined by local assessors to be the total taxable value of land and additions on the property. | Land | Improvement |
|---|---|---|---|---|
| 2024 | $1,292 | $110,400 | $43,000 | $67,400 |
| 2023 | $1,195 | $102,300 | $34,900 | $67,400 |
| 2022 | $1,092 | $91,600 | $32,800 | $58,800 |
| 2021 | $915 | $75,300 | $22,600 | $52,700 |
| 2020 | $866 | $76,100 | $22,600 | $53,500 |
| 2019 | $844 | $72,800 | $19,300 | $53,500 |
| 2018 | $841 | $71,600 | $19,300 | $52,300 |
| 2017 | $822 | $70,000 | $17,000 | $53,000 |
| 2016 | $740 | $63,200 | $10,200 | $53,000 |
| 2015 | $713 | $60,500 | $10,200 | $50,300 |
| 2014 | $796 | $67,700 | $17,000 | $50,700 |
Source: Public Records
Map
Nearby Homes
- 23 Berkeley Ct
- 28 Newington Ct N Unit N
- 80 Mountaineer Ct
- 169 Baltusrol Dr
- 296 Piedmont Ln
- 22 Brookline Cir
- 353 Spyglass Hill Dr
- 436 Spyglass Hill Dr
- 215 Brookline Dr
- 104 Carrell Ln
- 830 Sawgrass Dr
- 268 Oakmont Dr
- 825 Martin Luther King Junior Ave
- 106 S McDonald St
- 306 W 6th Ave
- HOMESITE 490 Westmoreland Way
- 59 Paddock Place
- HOMESITE 489 Westmoreland Way
- HOMESITE 493 Westmoreland Way
- HOMESITE 491 Westmoreland Way