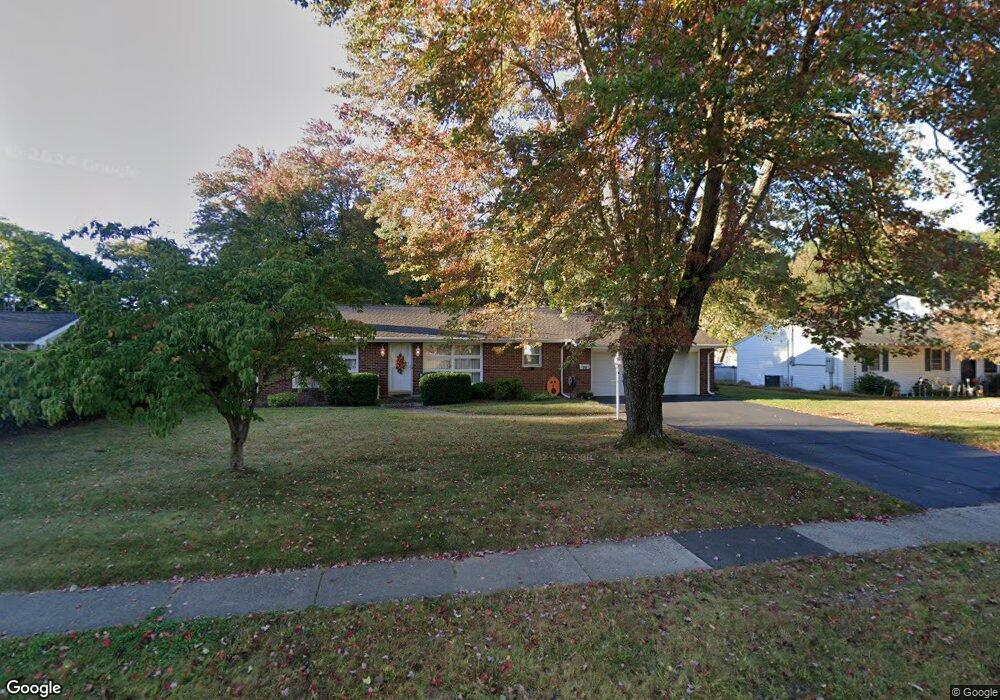
36 Betsy Rd Plainville, CT 06062
Estimated Value: $318,000 - $353,000
3
Beds
1
Bath
1,118
Sq Ft
$297/Sq Ft
Est. Value
About This Home
This home is located at 36 Betsy Rd, Plainville, CT 06062 and is currently estimated at $331,587, approximately $296 per square foot. 36 Betsy Rd is a home located in Hartford County with nearby schools including Middle School Of Plainville, Plainville High School, and Great Beginnings.
Ownership History
Date
Name
Owned For
Owner Type
Purchase Details
Closed on
Oct 17, 2023
Sold by
Woerz Susan C
Bought by
Woerz Susan C and Woerz James A
Current Estimated Value
Purchase Details
Closed on
Jun 21, 2023
Sold by
Woerz Susan C and Woerz James A
Bought by
Woerz Susan C
Purchase Details
Closed on
Sep 23, 2003
Sold by
Michaud Carl M
Bought by
Woerz James A and Woerz Susan C
Home Financials for this Owner
Home Financials are based on the most recent Mortgage that was taken out on this home.
Original Mortgage
$140,000
Interest Rate
5.25%
Mortgage Type
Purchase Money Mortgage
Purchase Details
Closed on
Jul 28, 1997
Sold by
Naples Geraldine P
Bought by
Michaud Carl M
Create a Home Valuation Report for This Property
The Home Valuation Report is an in-depth analysis detailing your home's value as well as a comparison with similar homes in the area
Home Values in the Area
Average Home Value in this Area
Purchase History
| Date | Buyer | Sale Price | Title Company |
|---|---|---|---|
| Woerz Susan C | -- | None Available | |
| Woerz Susan C | -- | None Available | |
| Woerz Susan C | -- | None Available | |
| Woerz Susan C | -- | None Available | |
| Woerz James A | $189,900 | -- | |
| Woerz James A | $189,900 | -- | |
| Michaud Carl M | $129,000 | -- | |
| Michaud Carl M | $129,000 | -- |
Source: Public Records
Mortgage History
| Date | Status | Borrower | Loan Amount |
|---|---|---|---|
| Previous Owner | Michaud Carl M | $27,000 | |
| Previous Owner | Michaud Carl M | $35,000 | |
| Previous Owner | Michaud Carl M | $140,000 |
Source: Public Records
Tax History
| Year | Tax Paid | Tax Assessment Tax Assessment Total Assessment is a certain percentage of the fair market value that is determined by local assessors to be the total taxable value of land and additions on the property. | Land | Improvement |
|---|---|---|---|---|
| 2025 | $4,830 | $140,560 | $57,960 | $82,600 |
| 2024 | $4,588 | $140,560 | $57,960 | $82,600 |
| 2023 | $4,416 | $140,560 | $57,960 | $82,600 |
| 2022 | $4,307 | $140,560 | $57,960 | $82,600 |
| 2021 | $4,108 | $118,860 | $50,400 | $68,460 |
| 2020 | $4,115 | $118,860 | $50,400 | $68,460 |
| 2019 | $4,115 | $118,860 | $50,400 | $68,460 |
| 2018 | $4,022 | $118,860 | $50,400 | $68,460 |
| 2017 | $3,884 | $118,860 | $50,400 | $68,460 |
| 2016 | $3,937 | $123,060 | $45,710 | $77,350 |
| 2015 | $3,917 | $123,060 | $45,710 | $77,350 |
| 2014 | $4,685 | $149,310 | $45,500 | $103,810 |
Source: Public Records
Map
Nearby Homes
- 48 Plum Tree Rd
- 62 Northampton Ln
- 35 Hardwood Rd
- 15 W Pine Way Unit 10
- 135 New Britain Ave Unit 5
- 50 Rockwell Ave
- 12 Rockwell Ave
- 33 Winter St
- 248 Woodford Ave Unit 9
- 71 White Oak Ave Unit B6
- 19 Maple St
- 152 Willow Brook Dr
- 24 Peace Ct
- 36 View St
- 50 Pierce St Unit 24
- 0 Oakwood Cir
- 32 Farmington Chase Crescent Unit 32
- 36 N Mountain Rd Unit D
- 240 Hillhurst Ave
- 157 Skinner Dr
Your Personal Tour Guide
Ask me questions while you tour the home.