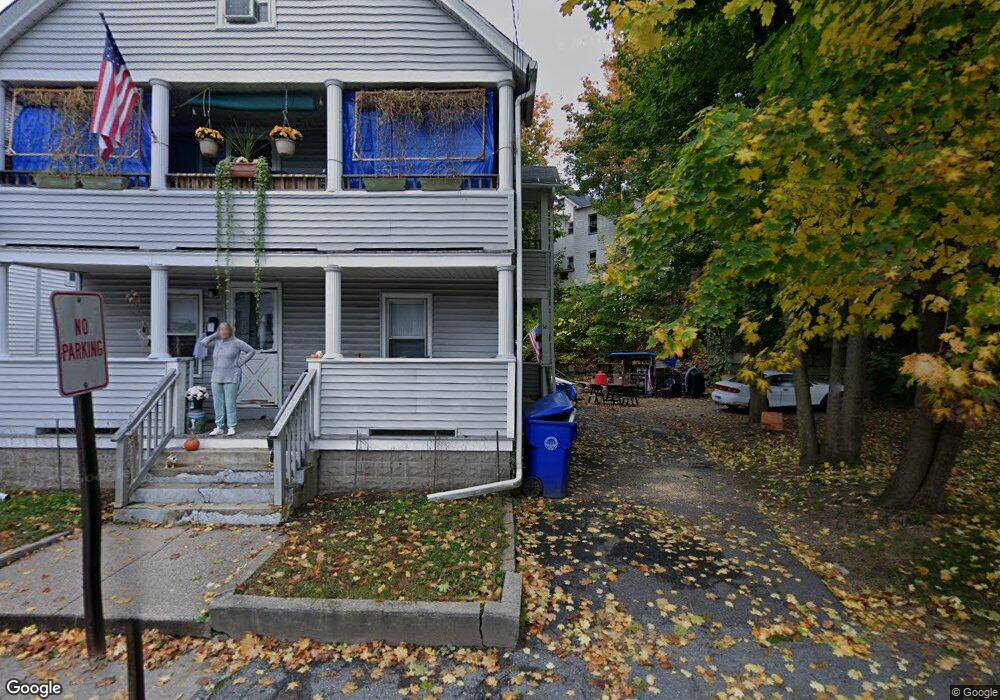
36 Brookside Ave Unit 1 Torrington, CT 06790
Estimated Value: $249,000 - $278,000
2
Beds
1
Bath
800
Sq Ft
$336/Sq Ft
Est. Value
About This Home
This home is located at 36 Brookside Ave Unit 1, Torrington, CT 06790 and is currently estimated at $269,060, approximately $336 per square foot. 36 Brookside Ave Unit 1 is a home located in Litchfield County with nearby schools including Torrington Middle School, Torrington High School, and St. Peter School.
Ownership History
Date
Name
Owned For
Owner Type
Purchase Details
Closed on
Jun 27, 2019
Sold by
Pelham T
Bought by
Vessio Joseph S
Current Estimated Value
Home Financials for this Owner
Home Financials are based on the most recent Mortgage that was taken out on this home.
Original Mortgage
$93,750
Outstanding Balance
$82,133
Interest Rate
3.82%
Mortgage Type
Purchase Money Mortgage
Estimated Equity
$186,927
Purchase Details
Closed on
Jul 20, 2015
Sold by
Pelham Robert M and Pelham Corrine G
Bought by
Pelham Robert M and Pelham Corrine G
Purchase Details
Closed on
Feb 7, 2005
Sold by
Betts Bruce E and Betts Catherine M
Bought by
Pelham Robert M and Pelham Corrine G
Home Financials for this Owner
Home Financials are based on the most recent Mortgage that was taken out on this home.
Original Mortgage
$120,800
Interest Rate
5.77%
Create a Home Valuation Report for This Property
The Home Valuation Report is an in-depth analysis detailing your home's value as well as a comparison with similar homes in the area
Home Values in the Area
Average Home Value in this Area
Purchase History
| Date | Buyer | Sale Price | Title Company |
|---|---|---|---|
| Vessio Joseph S | $128,500 | -- | |
| Pelham Robert M | -- | -- | |
| Pelham Robert M | $151,000 | -- |
Source: Public Records
Mortgage History
| Date | Status | Borrower | Loan Amount |
|---|---|---|---|
| Open | Vessio Joseph S | $93,750 | |
| Previous Owner | Pelham Robert M | $113,300 | |
| Previous Owner | Pelham Robert M | $121,300 | |
| Previous Owner | Pelham Robert M | $120,800 |
Source: Public Records
Tax History
| Year | Tax Paid | Tax Assessment Tax Assessment Total Assessment is a certain percentage of the fair market value that is determined by local assessors to be the total taxable value of land and additions on the property. | Land | Improvement |
|---|---|---|---|---|
| 2025 | $6,266 | $162,960 | $19,320 | $143,640 |
| 2024 | $3,929 | $81,910 | $19,320 | $62,590 |
| 2023 | $3,928 | $81,910 | $19,320 | $62,590 |
| 2022 | $3,861 | $81,910 | $19,320 | $62,590 |
| 2021 | $3,782 | $81,910 | $19,320 | $62,590 |
| 2020 | $3,782 | $81,910 | $19,320 | $62,590 |
| 2019 | $2,986 | $64,680 | $19,320 | $45,360 |
| 2018 | $2,986 | $64,680 | $19,320 | $45,360 |
| 2017 | $2,959 | $64,680 | $19,320 | $45,360 |
| 2016 | $2,959 | $64,680 | $19,320 | $45,360 |
| 2015 | $2,959 | $64,680 | $19,320 | $45,360 |
| 2014 | $3,070 | $84,540 | $23,520 | $61,020 |
Source: Public Records
Map
Nearby Homes
- 36 Brookside Ave
- 44 Brookside Ave
- 44 Brookside Ave Unit U2
- 44 Brookside Ave Unit U1
- 44 Brookside Ave Unit 3
- 285 E Main St
- 291 E Main St
- 48 Brookside Ave
- 48 Brookside Ave Unit 3
- 293 E Main St Unit 2ND
- 293 E Main St
- 295 E Main St
- 18 Britton Ave
- 271 E Main St
- 35 Brookside Ave
- 51 Brookside Ave
- 41 Brookside Ave
- 29 Brookside Ave
- 301 E Main St
- 49 Brookside Ave
Your Personal Tour Guide
Ask me questions while you tour the home.