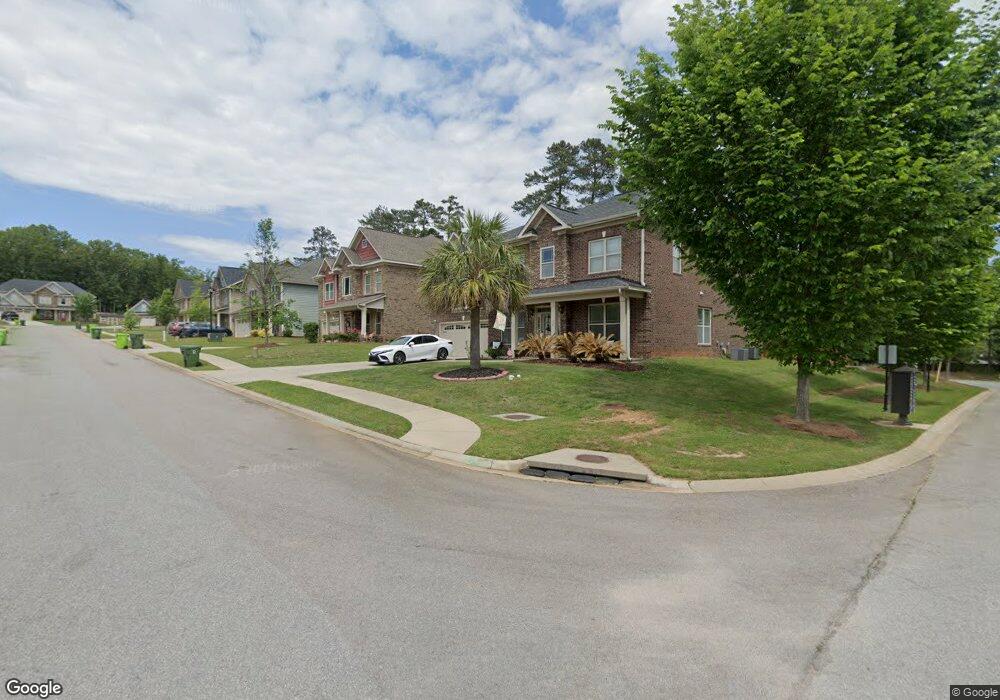
36 Bunchberry Ct Chapin, SC 29036
Estimated Value: $449,000 - $580,000
5
Beds
5
Baths
4,186
Sq Ft
$122/Sq Ft
Est. Value
About This Home
This home is located at 36 Bunchberry Ct, Chapin, SC 29036 and is currently estimated at $509,787, approximately $121 per square foot. 36 Bunchberry Ct is a home located in Richland County with nearby schools including Lake Murray Elementary School, Chapin Intermediate, and Chapin High School.
Ownership History
Date
Name
Owned For
Owner Type
Purchase Details
Closed on
Aug 7, 2014
Sold by
Fortress Builders Llc
Bought by
Frampton Drenia S and Frampton F
Current Estimated Value
Home Financials for this Owner
Home Financials are based on the most recent Mortgage that was taken out on this home.
Original Mortgage
$312,476
Outstanding Balance
$238,902
Interest Rate
4.26%
Mortgage Type
New Conventional
Estimated Equity
$270,885
Purchase Details
Closed on
Jul 23, 2014
Sold by
Fortress Builders Llc
Bought by
Seawright Terry T
Home Financials for this Owner
Home Financials are based on the most recent Mortgage that was taken out on this home.
Original Mortgage
$312,476
Outstanding Balance
$238,902
Interest Rate
4.26%
Mortgage Type
New Conventional
Estimated Equity
$270,885
Purchase Details
Closed on
Jun 20, 2014
Sold by
Fortress Builders Llc
Bought by
Loggins Brandon B
Home Financials for this Owner
Home Financials are based on the most recent Mortgage that was taken out on this home.
Original Mortgage
$312,476
Outstanding Balance
$238,902
Interest Rate
4.26%
Mortgage Type
New Conventional
Estimated Equity
$270,885
Purchase Details
Closed on
Jan 2, 2014
Sold by
Edenbrook Development Llc
Bought by
Fortress Builders Llc
Home Financials for this Owner
Home Financials are based on the most recent Mortgage that was taken out on this home.
Original Mortgage
$194,908
Interest Rate
4.29%
Mortgage Type
Purchase Money Mortgage
Purchase Details
Closed on
Sep 11, 2013
Sold by
Edenbrook Development Llc
Bought by
Fortrees Builders Llc
Home Financials for this Owner
Home Financials are based on the most recent Mortgage that was taken out on this home.
Original Mortgage
$202,300
Interest Rate
4.39%
Mortgage Type
Purchase Money Mortgage
Purchase Details
Closed on
Aug 26, 2013
Sold by
Edenbrook Development Llc
Bought by
Fortress Builders Llc
Home Financials for this Owner
Home Financials are based on the most recent Mortgage that was taken out on this home.
Original Mortgage
$202,300
Interest Rate
4.39%
Mortgage Type
Purchase Money Mortgage
Purchase Details
Closed on
Jul 29, 2013
Sold by
Three Dog Land Investors Llc
Bought by
Edenbrook Development Llc
Home Financials for this Owner
Home Financials are based on the most recent Mortgage that was taken out on this home.
Original Mortgage
$202,300
Interest Rate
4.39%
Mortgage Type
Purchase Money Mortgage
Purchase Details
Closed on
Nov 16, 2012
Sold by
Edenbrook Development Llc
Bought by
City Of Columbia
Purchase Details
Closed on
Dec 14, 2011
Sold by
Branch Banking & Trust Company
Bought by
Three Dog Land Investors Llc
Home Financials for this Owner
Home Financials are based on the most recent Mortgage that was taken out on this home.
Original Mortgage
$331,572
Interest Rate
4.06%
Mortgage Type
Purchase Money Mortgage
Purchase Details
Closed on
Sep 21, 2011
Sold by
Morgan Katie C
Bought by
Branch Banking & Trust Company
Create a Home Valuation Report for This Property
The Home Valuation Report is an in-depth analysis detailing your home's value as well as a comparison with similar homes in the area
Home Values in the Area
Average Home Value in this Area
Purchase History
| Date | Buyer | Sale Price | Title Company |
|---|---|---|---|
| Frampton Drenia S | $104,288 | -- | |
| Seawright Terry T | $129,461 | -- | |
| Loggins Brandon B | $115,288 | -- | |
| Fortress Builders Llc | $45,500 | None Available | |
| Fortrees Builders Llc | $182,000 | None Available | |
| Fortress Builders Llc | $45,500 | None Available | |
| Edenbrook Development Llc | -- | None Available | |
| City Of Columbia | -- | None Available | |
| Three Dog Land Investors Llc | $350,000 | -- | |
| Branch Banking & Trust Company | -- | -- |
Source: Public Records
Mortgage History
| Date | Status | Borrower | Loan Amount |
|---|---|---|---|
| Open | Seawright Terry T | $312,476 | |
| Previous Owner | Loggins Brandon B | $217,920 | |
| Previous Owner | Fortress Builders Llc | $194,908 | |
| Previous Owner | Fortress Builders Llc | $202,300 | |
| Previous Owner | Three Dog Land Investors Llc | $331,572 |
Source: Public Records
Tax History Compared to Growth
Tax History
| Year | Tax Paid | Tax Assessment Tax Assessment Total Assessment is a certain percentage of the fair market value that is determined by local assessors to be the total taxable value of land and additions on the property. | Land | Improvement |
|---|---|---|---|---|
| 2024 | $3,299 | $404,600 | $0 | $0 |
| 2023 | $3,170 | $14,072 | $0 | $0 |
| 2022 | $2,741 | $351,800 | $45,400 | $306,400 |
| 2021 | $2,784 | $14,070 | $0 | $0 |
| 2020 | $2,920 | $14,070 | $0 | $0 |
| 2019 | $2,916 | $14,070 | $0 | $0 |
| 2018 | $2,285 | $12,240 | $0 | $0 |
| 2017 | $2,223 | $12,240 | $0 | $0 |
| 2016 | $2,212 | $12,240 | $0 | $0 |
| 2015 | $2,224 | $12,240 | $0 | $0 |
| 2014 | $1,363 | $45,500 | $0 | $0 |
| 2013 | -- | $2,730 | $0 | $0 |
Source: Public Records
Map
Nearby Homes
- 44 Rustyred Ct
- 424 Lombard Way
- 342 Murray Falls Ln
- 328 Murray Falls Ln
- 319 Murray Falls Ln
- 7 Elk Run Ct
- 242 Murray Falls Ln
- 13 Elk Run Ct
- Lot 4 Lake Breeze
- 19 Elk Run Ct
- 29 Elk Run Ct
- 142 Almofini Ln
- 740 Ruskin Dr
- 550 Malachite Ln
- 515 Malachite Ln
- 509 Malachite Ln
- 13 Botticelli Ct
- 175 Almofini Ln
- 818 Ruskin Dr
- 1318 Portrait Hill Dr
- 32 Bunchberry Ct
- 40 Bunchberry Ct
- 46 Bunchberry Ct
- 33 Bunchberry Ct
- 50 Bunchberry Ct
- 117 Indian Grass Dr
- 41 Bunchberry Ct
- 32 Kitfox Ct
- 33 Kitfox Ct
- 47 Bunchberry Ct
- 56 Bunchberry Ct
- 123 Indian Grass Dr Unit 2
- 123 Indian Grass Dr
- 51 Bunchberry Ct
- 28 Kitfox Ct
- 29 Kitfox Ct
- 60 Bunchberry Ct
- 2 Featherfoil Ct
- 14 Featherfoil Ct
- 13 Redbrush Ct