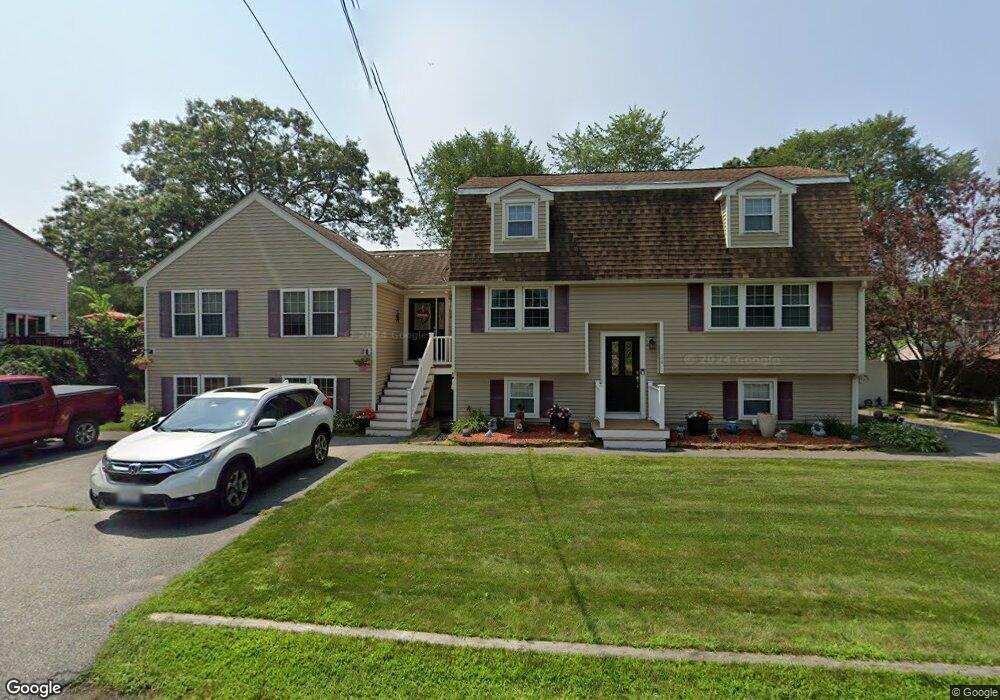
36 Burnap St Wilmington, MA 01887
Estimated Value: $887,958 - $994,000
5
Beds
3
Baths
2,283
Sq Ft
$411/Sq Ft
Est. Value
About This Home
This home is located at 36 Burnap St, Wilmington, MA 01887 and is currently estimated at $938,490, approximately $411 per square foot. 36 Burnap St is a home located in Middlesex County with nearby schools including Wilmington Middle School, Wilmington High School, and Abundant Life Christian School and Childcare.
Ownership History
Date
Name
Owned For
Owner Type
Purchase Details
Closed on
Dec 21, 2022
Sold by
Quigley Michael J and Quigley Kathleen A
Bought by
Michael J Quigley Ret
Current Estimated Value
Purchase Details
Closed on
Jan 24, 1992
Sold by
Caswell Scott and Caswell Julie
Bought by
Quigley Michael J
Purchase Details
Closed on
Jul 31, 1991
Sold by
Baker Irene B
Bought by
Murphy Sean P and Lisa Murphy
Purchase Details
Closed on
Nov 16, 1987
Sold by
Lopes Antonio
Bought by
Caswell Scott
Create a Home Valuation Report for This Property
The Home Valuation Report is an in-depth analysis detailing your home's value as well as a comparison with similar homes in the area
Home Values in the Area
Average Home Value in this Area
Purchase History
| Date | Buyer | Sale Price | Title Company |
|---|---|---|---|
| Michael J Quigley Ret | -- | None Available | |
| Quigley Michael J | $156,000 | -- | |
| Murphy Sean P | $156,000 | -- | |
| Caswell Scott | $168,000 | -- |
Source: Public Records
Mortgage History
| Date | Status | Borrower | Loan Amount |
|---|---|---|---|
| Previous Owner | Caswell Scott | $257,000 | |
| Previous Owner | Caswell Scott | $20,000 |
Source: Public Records
Tax History Compared to Growth
Tax History
| Year | Tax Paid | Tax Assessment Tax Assessment Total Assessment is a certain percentage of the fair market value that is determined by local assessors to be the total taxable value of land and additions on the property. | Land | Improvement |
|---|---|---|---|---|
| 2025 | $9,389 | $820,000 | $273,100 | $546,900 |
| 2024 | $9,046 | $791,400 | $273,100 | $518,300 |
| 2023 | $8,763 | $733,900 | $248,200 | $485,700 |
| 2022 | $8,403 | $644,900 | $206,800 | $438,100 |
| 2021 | $8,487 | $613,200 | $188,000 | $425,200 |
| 2020 | $8,660 | $637,700 | $188,000 | $449,700 |
| 2019 | $8,058 | $586,000 | $179,100 | $406,900 |
| 2018 | $7,797 | $541,100 | $170,500 | $370,600 |
| 2017 | $7,822 | $541,300 | $163,300 | $378,000 |
| 2016 | $7,217 | $493,300 | $155,500 | $337,800 |
| 2015 | $6,613 | $460,200 | $155,500 | $304,700 |
| 2014 | $6,179 | $433,900 | $148,100 | $285,800 |
Source: Public Records
Map
Nearby Homes