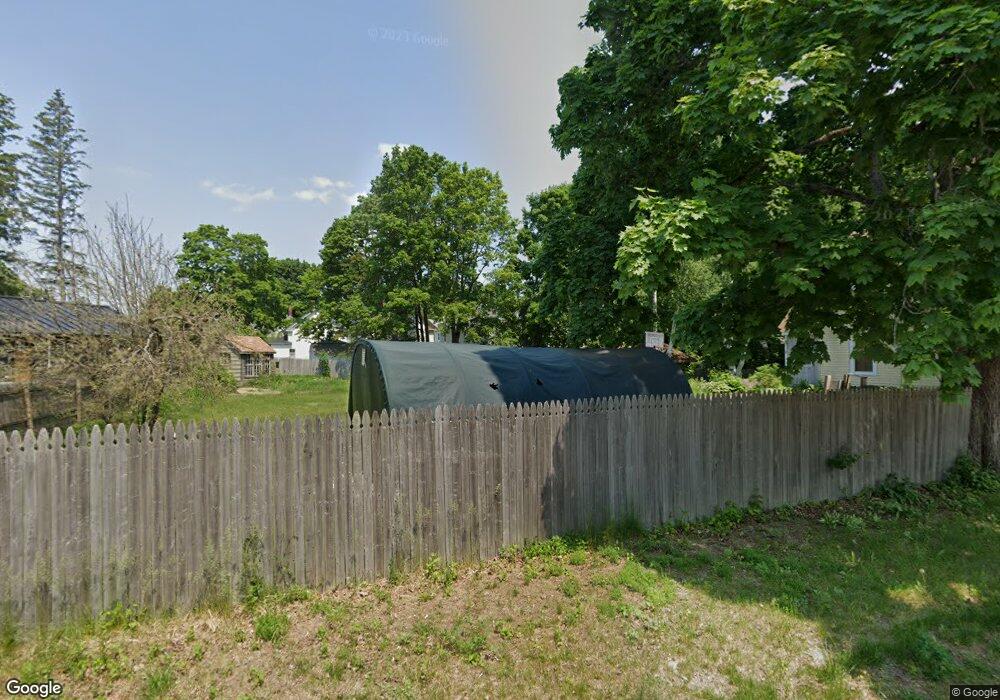
36 Burr St Brewer, ME 04412
Estimated Value: $233,756 - $292,000
3
Beds
2
Baths
1,660
Sq Ft
$151/Sq Ft
Est. Value
About This Home
This home is located at 36 Burr St, Brewer, ME 04412 and is currently estimated at $251,189, approximately $151 per square foot. 36 Burr St is a home located in Penobscot County with nearby schools including Brewer Community School, Brewer High School, and All Saints Catholic School St. Mary's campus PreK-3.
Ownership History
Date
Name
Owned For
Owner Type
Purchase Details
Closed on
Aug 10, 2011
Sold by
Murray Sherry
Bought by
Boguen Corey J and Dyer Jessica L
Current Estimated Value
Home Financials for this Owner
Home Financials are based on the most recent Mortgage that was taken out on this home.
Original Mortgage
$139,792
Outstanding Balance
$96,519
Interest Rate
4.51%
Mortgage Type
Purchase Money Mortgage
Estimated Equity
$154,670
Create a Home Valuation Report for This Property
The Home Valuation Report is an in-depth analysis detailing your home's value as well as a comparison with similar homes in the area
Home Values in the Area
Average Home Value in this Area
Purchase History
| Date | Buyer | Sale Price | Title Company |
|---|---|---|---|
| Boguen Corey J | -- | -- | |
| Boguen Corey J | -- | -- |
Source: Public Records
Mortgage History
| Date | Status | Borrower | Loan Amount |
|---|---|---|---|
| Open | Boguen Corey J | $139,792 | |
| Closed | Boguen Corey J | $139,792 | |
| Previous Owner | Boguen Corey J | $84,000 | |
| Previous Owner | Boguen Corey J | $27,000 | |
| Previous Owner | Boguen Corey J | $20,000 |
Source: Public Records
Tax History Compared to Growth
Tax History
| Year | Tax Paid | Tax Assessment Tax Assessment Total Assessment is a certain percentage of the fair market value that is determined by local assessors to be the total taxable value of land and additions on the property. | Land | Improvement |
|---|---|---|---|---|
| 2024 | $2,662 | $141,600 | $29,500 | $112,100 |
| 2023 | $2,557 | $127,200 | $27,700 | $99,500 |
| 2021 | $2,359 | $105,800 | $27,100 | $78,700 |
| 2020 | $2,407 | $105,800 | $27,100 | $78,700 |
| 2019 | $2,432 | $105,800 | $27,100 | $78,700 |
| 2018 | $2,054 | $91,300 | $27,100 | $64,200 |
| 2017 | $2,054 | $91,300 | $27,100 | $64,200 |
| 2016 | $1,965 | $91,300 | $27,100 | $64,200 |
| 2015 | $1,965 | $91,300 | $27,100 | $64,200 |
| 2014 | $1,920 | $91,800 | $27,100 | $64,700 |
| 2013 | $2,381 | $113,800 | $18,000 | $95,800 |
Source: Public Records
Map
Nearby Homes