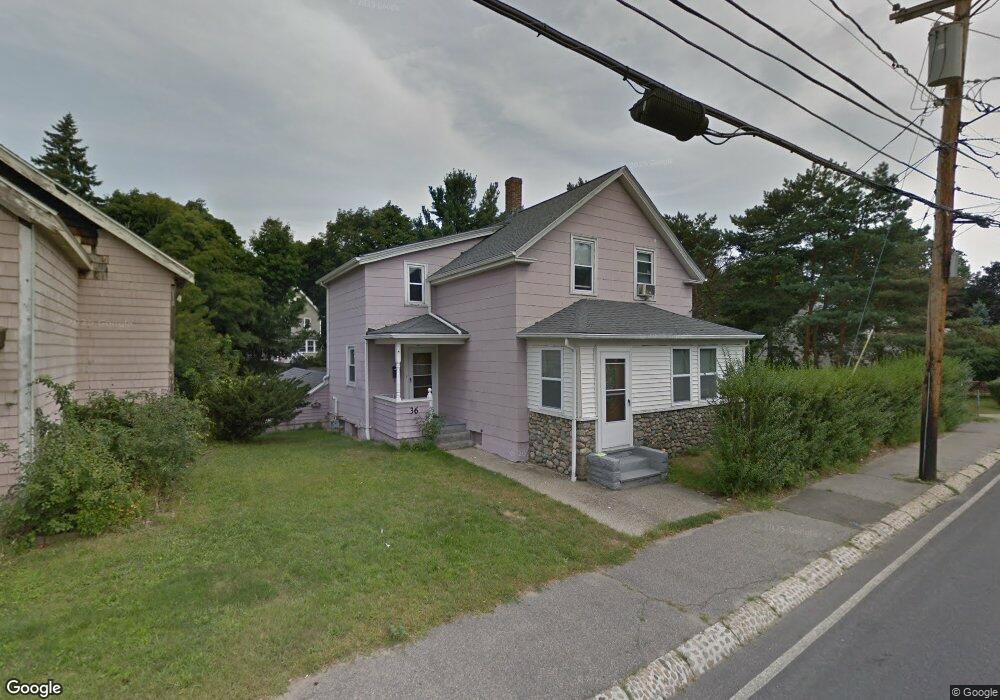
36 Bussey St Dedham, MA 02026
East Dedham NeighborhoodEstimated Value: $619,000 - $661,000
3
Beds
2
Baths
1,166
Sq Ft
$552/Sq Ft
Est. Value
About This Home
This home is located at 36 Bussey St, Dedham, MA 02026 and is currently estimated at $643,582, approximately $551 per square foot. 36 Bussey St is a home located in Norfolk County with nearby schools including Avery, Dedham Middle School, and Dedham High School.
Ownership History
Date
Name
Owned For
Owner Type
Purchase Details
Closed on
Oct 12, 2007
Sold by
Webb Robert A and Webb Vanessa C M
Bought by
Piverger Marie M
Current Estimated Value
Home Financials for this Owner
Home Financials are based on the most recent Mortgage that was taken out on this home.
Original Mortgage
$285,000
Outstanding Balance
$180,524
Interest Rate
6.49%
Mortgage Type
Purchase Money Mortgage
Estimated Equity
$463,058
Purchase Details
Closed on
Aug 15, 1996
Sold by
Martins Doris F
Bought by
Webb Robert A and Webb Vanessa Cm
Home Financials for this Owner
Home Financials are based on the most recent Mortgage that was taken out on this home.
Original Mortgage
$112,500
Interest Rate
8.08%
Mortgage Type
Purchase Money Mortgage
Create a Home Valuation Report for This Property
The Home Valuation Report is an in-depth analysis detailing your home's value as well as a comparison with similar homes in the area
Home Values in the Area
Average Home Value in this Area
Purchase History
| Date | Buyer | Sale Price | Title Company |
|---|---|---|---|
| Piverger Marie M | $285,000 | -- | |
| Webb Robert A | $137,500 | -- |
Source: Public Records
Mortgage History
| Date | Status | Borrower | Loan Amount |
|---|---|---|---|
| Open | Piverger Marie M | $285,000 | |
| Previous Owner | Webb Robert A | $110,000 | |
| Previous Owner | Webb Robert A | $112,500 | |
| Previous Owner | Webb Robert A | $45,000 |
Source: Public Records
Tax History Compared to Growth
Tax History
| Year | Tax Paid | Tax Assessment Tax Assessment Total Assessment is a certain percentage of the fair market value that is determined by local assessors to be the total taxable value of land and additions on the property. | Land | Improvement |
|---|---|---|---|---|
| 2025 | $7,193 | $570,000 | $282,200 | $287,800 |
| 2024 | $6,844 | $547,500 | $267,300 | $280,200 |
| 2023 | $6,563 | $511,100 | $237,200 | $273,900 |
| 2022 | $6,280 | $470,400 | $232,300 | $238,100 |
| 2021 | $5,877 | $429,900 | $227,300 | $202,600 |
| 2020 | $5,760 | $419,800 | $217,200 | $202,600 |
| 2019 | $5,475 | $386,900 | $188,900 | $198,000 |
| 2018 | $5,398 | $371,000 | $166,900 | $204,100 |
| 2017 | $5,182 | $351,100 | $156,200 | $194,900 |
| 2016 | $5,260 | $339,600 | $136,500 | $203,100 |
| 2015 | $5,109 | $321,900 | $133,800 | $188,100 |
| 2014 | $4,933 | $306,800 | $130,800 | $176,000 |
Source: Public Records
Map
Nearby Homes
- 94 Rockland St
- 83 Mount Hope St
- 70 Birchwood St
- 25R Rockland St Unit 6
- 69 Berlin St
- 5245 Washington St Unit 5
- 235 Curve St
- 11 Cheriton Rd Unit 102B
- 108 High St
- 40 Unit 207
- 38 Fleming St
- 38 Joan Rd
- 150 Grove St
- 7 S Stone Mill Dr Unit 403
- 45 Dietz Rd
- 42 Churchill Place
- 3 Lewis Farm Rd
- 42 Raldne Rd Unit 1
- 56 Mount Vernon St
- 8 Fort Ln