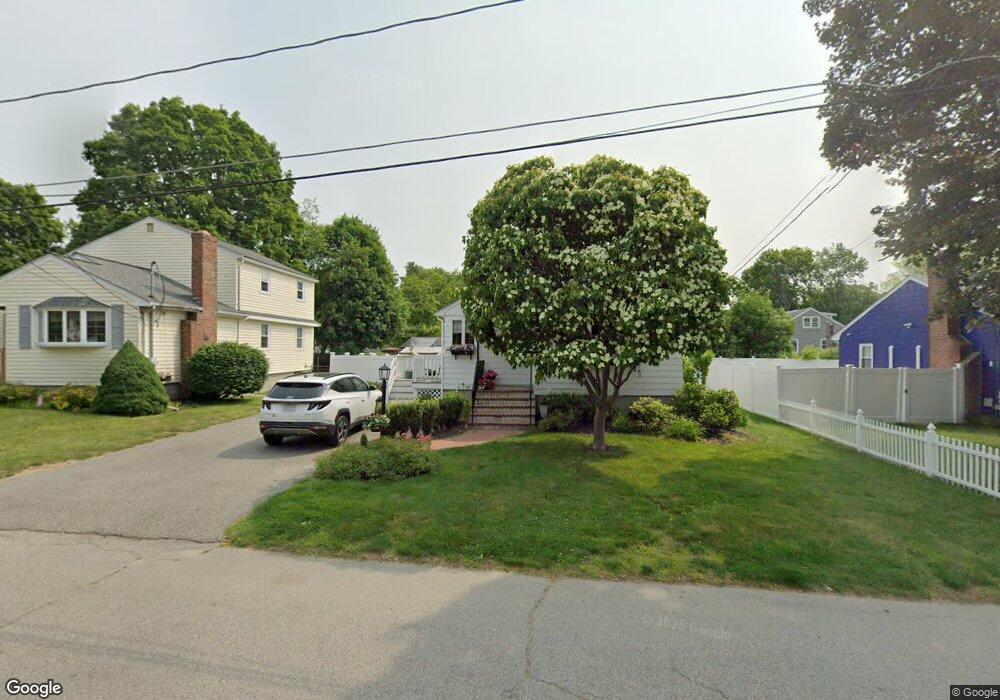
36 Cambo St Brockton, MA 02301
Clifton Heights NeighborhoodEstimated Value: $447,000 - $464,833
3
Beds
1
Bath
968
Sq Ft
$471/Sq Ft
Est. Value
About This Home
This home is located at 36 Cambo St, Brockton, MA 02301 and is currently estimated at $455,458, approximately $470 per square foot. 36 Cambo St is a home located in Plymouth County with nearby schools including Gilmore Elementary School, John F. Kennedy Elementary School, and Davis K-8 School.
Ownership History
Date
Name
Owned For
Owner Type
Purchase Details
Closed on
Oct 5, 1988
Sold by
Paiva Francis V
Bought by
Caniglia Joseph A
Current Estimated Value
Home Financials for this Owner
Home Financials are based on the most recent Mortgage that was taken out on this home.
Original Mortgage
$89,000
Interest Rate
10.64%
Mortgage Type
Purchase Money Mortgage
Create a Home Valuation Report for This Property
The Home Valuation Report is an in-depth analysis detailing your home's value as well as a comparison with similar homes in the area
Home Values in the Area
Average Home Value in this Area
Purchase History
| Date | Buyer | Sale Price | Title Company |
|---|---|---|---|
| Caniglia Joseph A | $100,000 | -- |
Source: Public Records
Mortgage History
| Date | Status | Borrower | Loan Amount |
|---|---|---|---|
| Open | Caniglia Joseph A | $125,000 | |
| Closed | Caniglia Joseph A | $89,000 |
Source: Public Records
Tax History Compared to Growth
Tax History
| Year | Tax Paid | Tax Assessment Tax Assessment Total Assessment is a certain percentage of the fair market value that is determined by local assessors to be the total taxable value of land and additions on the property. | Land | Improvement |
|---|---|---|---|---|
| 2025 | $4,699 | $388,000 | $143,500 | $244,500 |
| 2024 | $4,572 | $380,400 | $143,500 | $236,900 |
| 2023 | $4,581 | $352,900 | $108,000 | $244,900 |
| 2022 | $4,226 | $302,500 | $98,000 | $204,500 |
| 2021 | $4,038 | $278,500 | $89,300 | $189,200 |
| 2020 | $3,989 | $263,300 | $85,900 | $177,400 |
| 2019 | $4,042 | $260,100 | $78,800 | $181,300 |
| 2018 | $3,559 | $221,600 | $78,800 | $142,800 |
| 2017 | $3,151 | $195,700 | $78,800 | $116,900 |
| 2016 | $2,974 | $171,300 | $75,100 | $96,200 |
| 2015 | $2,977 | $164,000 | $75,100 | $88,900 |
| 2014 | $2,770 | $152,800 | $75,100 | $77,700 |
Source: Public Records
Map
Nearby Homes