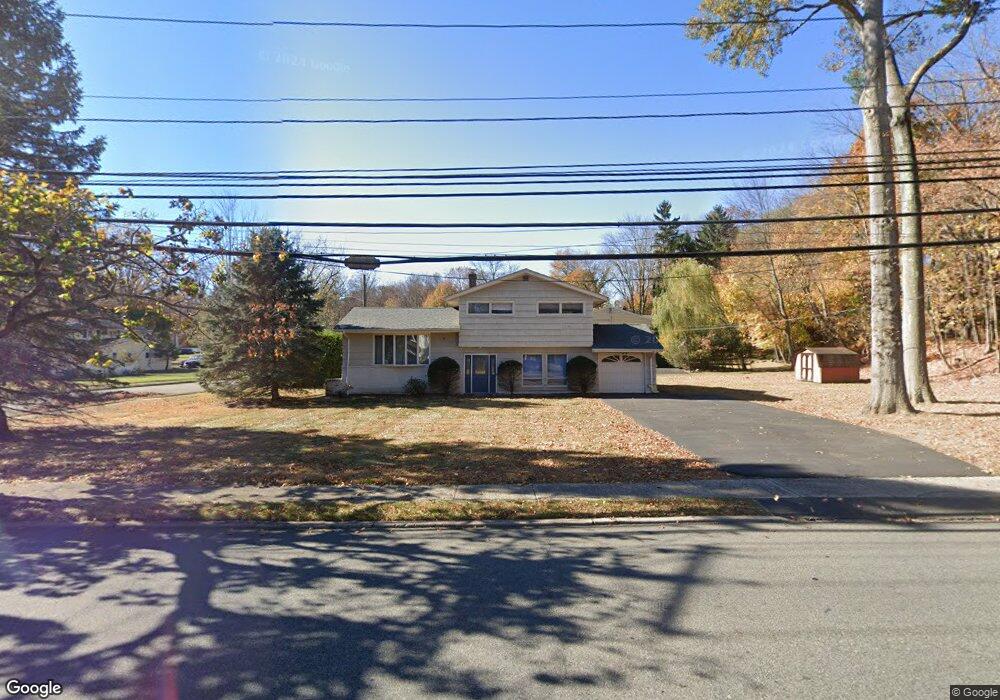
36 Crescent Ave Waldwick, NJ 07463
Estimated Value: $664,339 - $776,000
Studio
--
Bath
1,631
Sq Ft
$447/Sq Ft
Est. Value
About This Home
This home is located at 36 Crescent Ave, Waldwick, NJ 07463 and is currently estimated at $729,835, approximately $447 per square foot. 36 Crescent Ave is a home located in Bergen County with nearby schools including Waldwick High School, The Village School - Montessori, and Waldwick Seventh-Day Adventist School.
Ownership History
Date
Name
Owned For
Owner Type
Purchase Details
Closed on
Sep 21, 2000
Bought by
Skurna Joseph G
Current Estimated Value
Home Financials for this Owner
Home Financials are based on the most recent Mortgage that was taken out on this home.
Original Mortgage
$38,000
Interest Rate
7.64%
Purchase Details
Closed on
Mar 26, 1990
Bought by
Skurna Joseph G and Skurna Mary E
Create a Home Valuation Report for This Property
The Home Valuation Report is an in-depth analysis detailing your home's value as well as a comparison with similar homes in the area
Home Values in the Area
Average Home Value in this Area
Purchase History
| Date | Buyer | Sale Price | Title Company |
|---|---|---|---|
| Skurna Joseph G | -- | -- | |
| Skurna Joseph G | -- | -- | |
| Skurna Joseph G | $200,000 | -- |
Source: Public Records
Mortgage History
| Date | Status | Borrower | Loan Amount |
|---|---|---|---|
| Previous Owner | Skurna Joseph G | $38,000 |
Source: Public Records
Tax History
| Year | Tax Paid | Tax Assessment Tax Assessment Total Assessment is a certain percentage of the fair market value that is determined by local assessors to be the total taxable value of land and additions on the property. | Land | Improvement |
|---|---|---|---|---|
| 2025 | $11,883 | $536,700 | $312,800 | $223,900 |
| 2024 | $13,165 | $536,700 | $312,800 | $223,900 |
| 2023 | $12,893 | $452,700 | $272,600 | $180,100 |
| 2022 | $12,893 | $452,700 | $272,600 | $180,100 |
| 2021 | $12,648 | $452,700 | $272,600 | $180,100 |
| 2020 | $12,526 | $452,700 | $272,600 | $180,100 |
| 2019 | $12,522 | $452,700 | $272,600 | $180,100 |
| 2018 | $12,128 | $452,700 | $272,600 | $180,100 |
| 2017 | $12,024 | $452,700 | $272,600 | $180,100 |
| 2016 | $11,779 | $452,700 | $272,600 | $180,100 |
| 2015 | $11,643 | $452,700 | $272,600 | $180,100 |
| 2014 | $11,363 | $447,500 | $272,600 | $174,900 |
Source: Public Records
Map
Nearby Homes
Your Personal Tour Guide
Ask me questions while you tour the home.