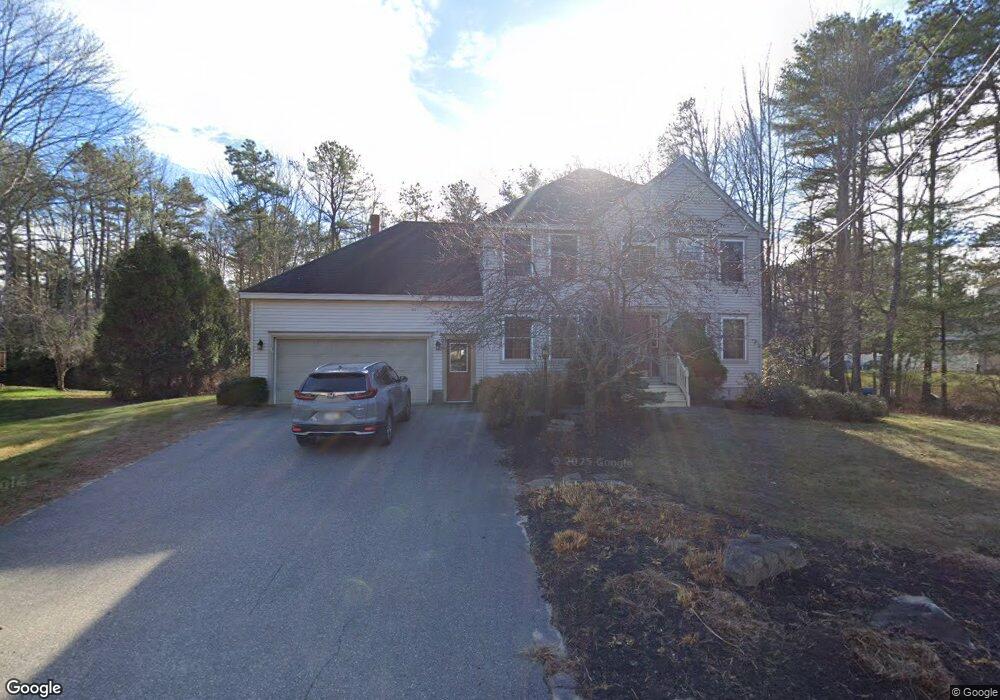
36 Cushnoc Ln Brunswick, ME 04011
Estimated Value: $645,000 - $793,000
3
Beds
3
Baths
2,078
Sq Ft
$338/Sq Ft
Est. Value
About This Home
This home is located at 36 Cushnoc Ln, Brunswick, ME 04011 and is currently estimated at $702,508, approximately $338 per square foot. 36 Cushnoc Ln is a home located in Cumberland County with nearby schools including Kate Furbish Elementary School, Brunswick Jr High School, and Brunswick High School.
Ownership History
Date
Name
Owned For
Owner Type
Purchase Details
Closed on
Sep 20, 2006
Sold by
Davies Jonathan F and Davies Susan R
Bought by
Yee William and Yee Lila R
Current Estimated Value
Home Financials for this Owner
Home Financials are based on the most recent Mortgage that was taken out on this home.
Original Mortgage
$280,000
Outstanding Balance
$167,417
Interest Rate
6.59%
Mortgage Type
Purchase Money Mortgage
Estimated Equity
$535,091
Create a Home Valuation Report for This Property
The Home Valuation Report is an in-depth analysis detailing your home's value as well as a comparison with similar homes in the area
Home Values in the Area
Average Home Value in this Area
Purchase History
| Date | Buyer | Sale Price | Title Company |
|---|---|---|---|
| Yee William | -- | -- |
Source: Public Records
Mortgage History
| Date | Status | Borrower | Loan Amount |
|---|---|---|---|
| Open | Yee William | $280,000 |
Source: Public Records
Tax History Compared to Growth
Tax History
| Year | Tax Paid | Tax Assessment Tax Assessment Total Assessment is a certain percentage of the fair market value that is determined by local assessors to be the total taxable value of land and additions on the property. | Land | Improvement |
|---|---|---|---|---|
| 2024 | $7,811 | $327,500 | $73,300 | $254,200 |
| 2023 | $7,627 | $327,500 | $73,300 | $254,200 |
| 2022 | $7,097 | $327,200 | $73,300 | $253,900 |
| 2021 | $6,825 | $327,200 | $73,300 | $253,900 |
| 2020 | $6,665 | $327,200 | $73,300 | $253,900 |
| 2019 | $6,452 | $327,200 | $73,300 | $253,900 |
| 2018 | $6,191 | $327,200 | $73,300 | $253,900 |
| 2017 | $6,011 | $327,200 | $73,300 | $253,900 |
| 2016 | $5,852 | $199,400 | $47,500 | $151,900 |
| 2015 | $5,655 | $199,400 | $47,500 | $151,900 |
| 2014 | $5,272 | $199,400 | $47,500 | $151,900 |
| 2013 | -- | $199,400 | $47,500 | $151,900 |
Source: Public Records
Map
Nearby Homes
- 6 Melden Dr
- 0 Melden Dr
- 250 Mere Point Rd
- 10 Kitt St
- 2 Foxglove Way Unit 89
- Lot 8 Village Cir
- 23 Village Cir
- 32 Village Cir
- 20 Bowdoin St
- Lot 14 Village Cir
- 20 Village Cir
- 9 Village Cir
- 11 Elwell Ln
- 60 County Crossing
- 26 County Crossing
- 35 & 35.5 Bath Rd
- 35.5 Bath Rd
- 35 Bath Rd
- 124 Columbia Ave
- 81 Willow Grove Rd