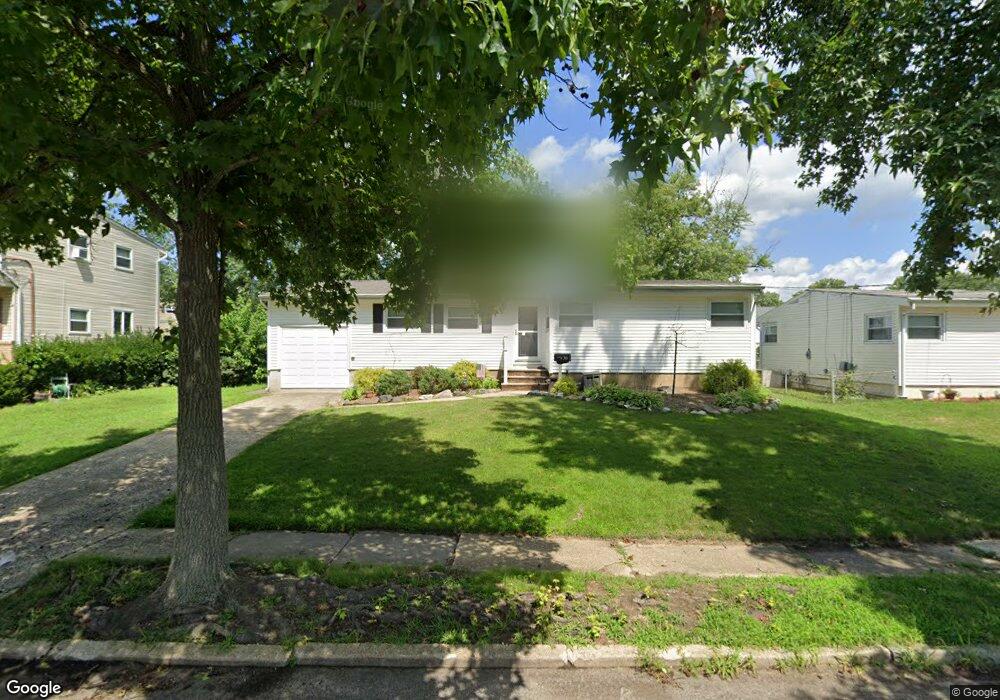
36 Dartmouth Dr Hazlet, NJ 07730
Estimated Value: $501,000 - $583,000
4
Beds
2
Baths
1,320
Sq Ft
$414/Sq Ft
Est. Value
About This Home
This home is located at 36 Dartmouth Dr, Hazlet, NJ 07730 and is currently estimated at $546,239, approximately $413 per square foot. 36 Dartmouth Dr is a home located in Monmouth County with nearby schools including Raritan High School.
Ownership History
Date
Name
Owned For
Owner Type
Purchase Details
Closed on
Mar 7, 2003
Sold by
Faranello Scott
Bought by
Kauffman John and Kauffman Tarin
Current Estimated Value
Home Financials for this Owner
Home Financials are based on the most recent Mortgage that was taken out on this home.
Original Mortgage
$223,000
Outstanding Balance
$96,287
Interest Rate
5.94%
Estimated Equity
$449,952
Purchase Details
Closed on
Jan 31, 2001
Sold by
Martino Michael
Bought by
Faranello Scott and Faranello Judith
Home Financials for this Owner
Home Financials are based on the most recent Mortgage that was taken out on this home.
Original Mortgage
$168,000
Interest Rate
7.13%
Create a Home Valuation Report for This Property
The Home Valuation Report is an in-depth analysis detailing your home's value as well as a comparison with similar homes in the area
Home Values in the Area
Average Home Value in this Area
Purchase History
| Date | Buyer | Sale Price | Title Company |
|---|---|---|---|
| Kauffman John | $238,000 | -- | |
| Faranello Scott | $210,000 | -- |
Source: Public Records
Mortgage History
| Date | Status | Borrower | Loan Amount |
|---|---|---|---|
| Open | Kauffman John | $223,000 | |
| Previous Owner | Faranello Scott | $168,000 |
Source: Public Records
Tax History Compared to Growth
Tax History
| Year | Tax Paid | Tax Assessment Tax Assessment Total Assessment is a certain percentage of the fair market value that is determined by local assessors to be the total taxable value of land and additions on the property. | Land | Improvement |
|---|---|---|---|---|
| 2025 | $9,445 | $501,700 | $346,000 | $155,700 |
| 2024 | $9,183 | $449,100 | $294,000 | $155,100 |
| 2023 | $9,183 | $429,700 | $276,000 | $153,700 |
| 2022 | $8,475 | $364,300 | $229,000 | $135,300 |
| 2021 | $8,475 | $330,400 | $210,000 | $120,400 |
| 2020 | $8,332 | $322,700 | $205,000 | $117,700 |
| 2019 | $8,053 | $307,000 | $190,000 | $117,000 |
| 2018 | $7,842 | $296,500 | $185,000 | $111,500 |
| 2017 | $7,382 | $279,100 | $171,000 | $108,100 |
| 2016 | $7,283 | $276,400 | $171,000 | $105,400 |
| 2015 | $7,061 | $268,700 | $166,000 | $102,700 |
| 2014 | $6,658 | $237,600 | $130,000 | $107,600 |
Source: Public Records
Map
Nearby Homes