
Seller's Agent in 2023
Suzanne Ranieri
Coldwell Banker Realty - Franklin
(508) 380-1643
47 in this area
115 Total Sales
Estimated Value: $618,000 - $682,000
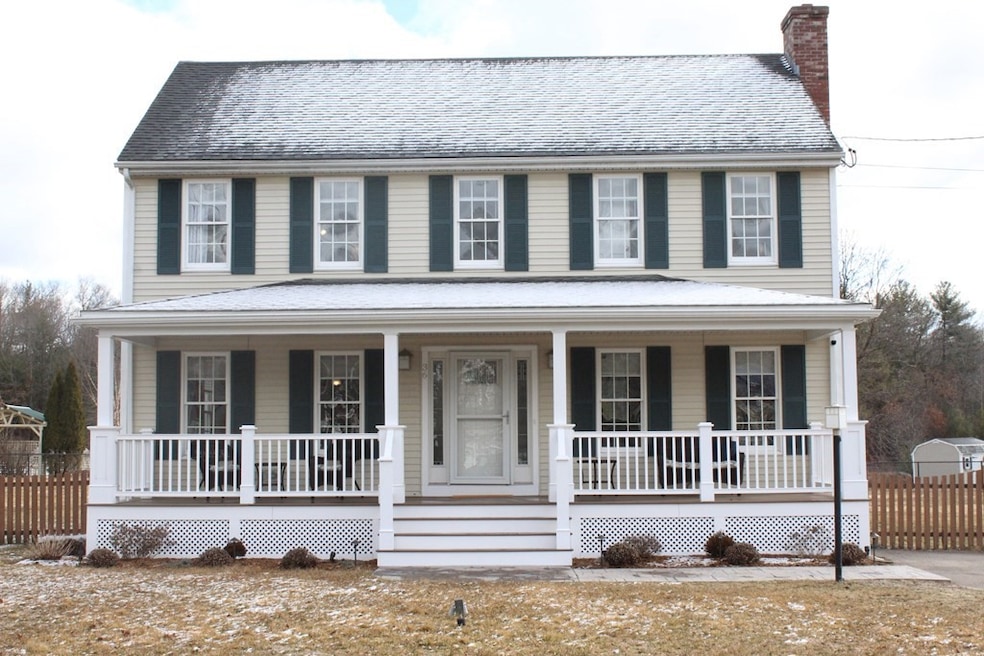
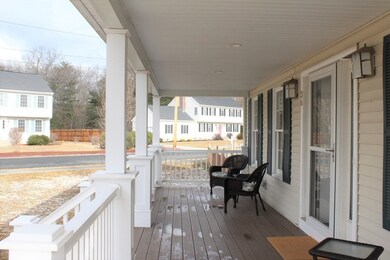
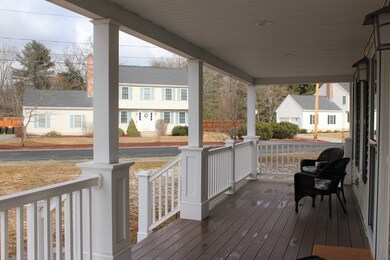
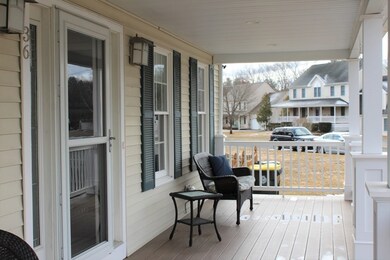
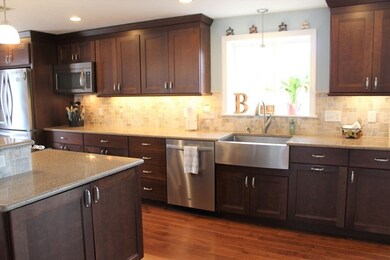
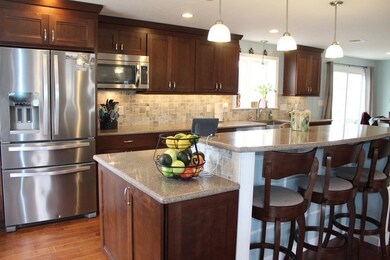
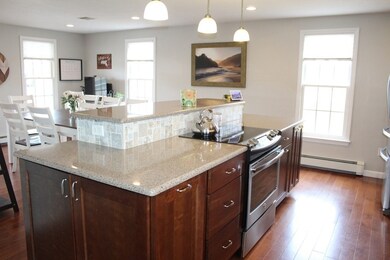
Welcome to this beautiful home! You will love the open floor plan & stunning new kitchen w/ gorgeous cabinets, granite counters, a spacious 2 level center island, stainless appliances & recessed lights. Enjoy family dinners in the dining room & relax on those cold winter nights by the fireplace in the living room. .Hardwood floors throughout the 1st floor, the staircase & upstairs hallway. 3 large bedrooms & a hollywood style bath complete the second floor. The professionally finished family room in the basement provides additional living space for the entire family. Enjoy the beautiful weather on the oversized deck leading to a completely level, fenced yard & firepit. Get your rocking chairs & watch the sun set from the maintenance free farmer's porch. Additional features include a top of the line Buderus furnace, town water & sewer & leased solar panels to save on electricity. Roughed for central air. Showings begin now.. OH 3/18 from 11-12:30. Range priced $575,000-$600,000.
Last Agent to Sell the Property
Coldwell Banker Realty - Franklin Listed on: 03/15/2023
| Date | Buyer | Sale Price | Title Company |
|---|---|---|---|
| Matte Emily | -- | -- | |
| Pimentel Marcos | $610,000 | None Available | |
| Bartlett Scott D | $175,000 | -- | |
| Bartlett Scott D | $175,000 | -- |
| Date | Status | Borrower | Loan Amount |
|---|---|---|---|
| Open | Matte Emily | $374,000 | |
| Previous Owner | Pimentel Marcos | $488,000 | |
| Previous Owner | Bartlett Scott D | $140,000 |
| Date | Event | Price | List to Sale | Price per Sq Ft |
|---|---|---|---|---|
| 05/04/2023 05/04/23 | Sold | $610,000 | +6.1% | $353 / Sq Ft |
| 03/20/2023 03/20/23 | Pending | -- | -- | -- |
| 03/15/2023 03/15/23 | For Sale | $575,000 | -- | $333 / Sq Ft |
| Year | Tax Paid | Tax Assessment Tax Assessment Total Assessment is a certain percentage of the fair market value that is determined by local assessors to be the total taxable value of land and additions on the property. | Land | Improvement |
|---|---|---|---|---|
| 2025 | $6,851 | $545,500 | $172,200 | $373,300 |
| 2024 | $6,564 | $510,400 | $157,300 | $353,100 |
| 2023 | $5,953 | $456,200 | $149,800 | $306,400 |
| 2022 | $5,878 | $417,500 | $127,600 | $289,900 |
| 2021 | $5,675 | $393,800 | $127,600 | $266,200 |
| 2020 | $5,345 | $375,900 | $127,600 | $248,300 |
| 2019 | $5,101 | $359,000 | $127,600 | $231,400 |
| 2018 | $4,780 | $331,700 | $124,200 | $207,500 |
| 2017 | $4,638 | $323,400 | $124,200 | $199,200 |
| 2016 | $4,559 | $319,000 | $132,700 | $186,300 |
| 2015 | $4,372 | $306,800 | $127,600 | $179,200 |
| 2014 | $4,389 | $299,400 | $125,100 | $174,300 |
Seller's Agent in 2023
Suzanne Ranieri
Coldwell Banker Realty - Franklin
(508) 380-1643
47 in this area
115 Total Sales
M
Buyer's Agent in 2023
Marisa Hardina
Noble Realty & Consulting, LLC
(774) 280-4631
1 in this area
17 Total Sales
Source: MLS Property Information Network (MLS PIN)
MLS Number: 73088043
APN: BELL-000091-000006-000025
Disclaimer: Certain information contained herein is derived from information provided by parties other than Homes.com. All information provided is deemed reliable, but is not guaranteed to be accurate and should be independently verified.
![]() The property listing data and information, or the Images, set forth herein were provided to MLS Property Information Network, Inc. from third party sources, including sellers, lessors and public records, and were compiled by MLS Property Information Network, Inc. The property listing data and information, and the Images, are for the personal, non-commercial use of consumers having a good faith interest in purchasing or leasing listed properties of the type displayed to them and may not be used for any purpose other than to identify prospective properties which such consumers may have a good faith interest in purchasing or leasing. MLS Property Information Network, Inc. and its subscribers disclaim any and all representations and warranties as to the accuracy of the property listing data and information, or as to the accuracy of any of the Images, set forth herein.
The property listing data and information, or the Images, set forth herein were provided to MLS Property Information Network, Inc. from third party sources, including sellers, lessors and public records, and were compiled by MLS Property Information Network, Inc. The property listing data and information, and the Images, are for the personal, non-commercial use of consumers having a good faith interest in purchasing or leasing listed properties of the type displayed to them and may not be used for any purpose other than to identify prospective properties which such consumers may have a good faith interest in purchasing or leasing. MLS Property Information Network, Inc. and its subscribers disclaim any and all representations and warranties as to the accuracy of the property listing data and information, or as to the accuracy of any of the Images, set forth herein.
Ask me questions while you tour the home.