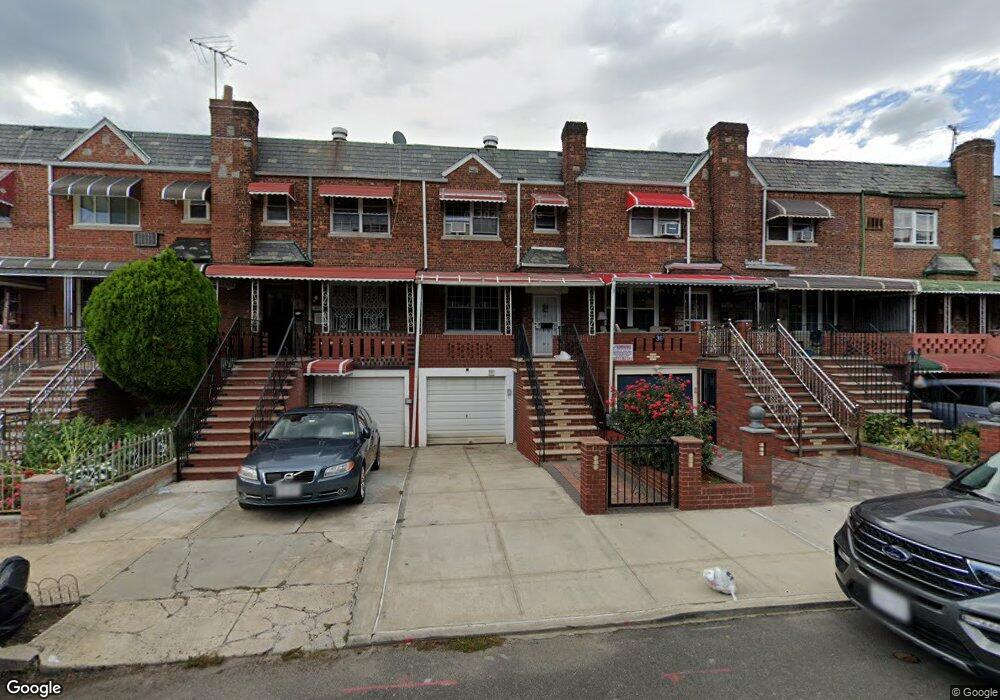
36 E 58th St Brooklyn, NY 11203
East Flatbush NeighborhoodEstimated Value: $702,352 - $821,000
Studio
--
Bath
1,812
Sq Ft
$428/Sq Ft
Est. Value
About This Home
This home is located at 36 E 58th St, Brooklyn, NY 11203 and is currently estimated at $774,838, approximately $427 per square foot. 36 E 58th St is a home located in Kings County with nearby schools including P.S. 268 Emma Lazarus, East Flatbush Community Research School, and Kings Elementary School.
Ownership History
Date
Name
Owned For
Owner Type
Purchase Details
Closed on
Nov 22, 2010
Sold by
Smith & Goldstein Development Corp
Bought by
Mckenna Andre
Current Estimated Value
Home Financials for this Owner
Home Financials are based on the most recent Mortgage that was taken out on this home.
Original Mortgage
$357,918
Interest Rate
5.07%
Mortgage Type
Purchase Money Mortgage
Purchase Details
Closed on
Apr 23, 2010
Sold by
Griffith Sherwin
Bought by
Smith And Goldstein Development Corp
Purchase Details
Closed on
Jan 25, 2007
Sold by
Evans Joyce
Bought by
Griffith Sherwin
Home Financials for this Owner
Home Financials are based on the most recent Mortgage that was taken out on this home.
Original Mortgage
$392,000
Interest Rate
6.22%
Mortgage Type
Purchase Money Mortgage
Purchase Details
Closed on
Aug 15, 2005
Sold by
Ullah Mohammed Hafiz
Bought by
Evans Joyce
Home Financials for this Owner
Home Financials are based on the most recent Mortgage that was taken out on this home.
Original Mortgage
$398,000
Interest Rate
5.68%
Mortgage Type
Purchase Money Mortgage
Purchase Details
Closed on
Feb 20, 2004
Sold by
Monteleone Referee John A
Bought by
Ullah Mohammed Hafiz
Home Financials for this Owner
Home Financials are based on the most recent Mortgage that was taken out on this home.
Original Mortgage
$220,500
Interest Rate
5.62%
Mortgage Type
Purchase Money Mortgage
Purchase Details
Closed on
Jul 1, 2002
Sold by
Diana Marica
Bought by
Layne Harriette
Home Financials for this Owner
Home Financials are based on the most recent Mortgage that was taken out on this home.
Original Mortgage
$212,000
Interest Rate
6.2%
Purchase Details
Closed on
Mar 23, 2000
Sold by
Chief Home Investment Corp
Bought by
Salmon Marcia Dianna Frith and Salmon Paul
Home Financials for this Owner
Home Financials are based on the most recent Mortgage that was taken out on this home.
Original Mortgage
$197,395
Interest Rate
8.1%
Mortgage Type
FHA
Purchase Details
Closed on
Mar 13, 2000
Sold by
Delta Funding Corp
Bought by
Chief Home Investment Corp
Home Financials for this Owner
Home Financials are based on the most recent Mortgage that was taken out on this home.
Original Mortgage
$197,395
Interest Rate
8.1%
Mortgage Type
FHA
Purchase Details
Closed on
Oct 11, 1996
Sold by
Lewis Boncellia
Bought by
Lewis Boncella and Lucas Grayson
Create a Home Valuation Report for This Property
The Home Valuation Report is an in-depth analysis detailing your home's value as well as a comparison with similar homes in the area
Home Values in the Area
Average Home Value in this Area
Purchase History
| Date | Buyer | Sale Price | Title Company |
|---|---|---|---|
| Mckenna Andre | $375,000 | -- | |
| Mckenna Andre | $375,000 | -- | |
| Smith And Goldstein Development Corp | -- | -- | |
| Smith And Goldstein Development Corp | -- | -- | |
| Griffith Sherwin | $490,000 | -- | |
| Griffith Sherwin | $490,000 | -- | |
| Evans Joyce | $398,000 | -- | |
| Evans Joyce | $398,000 | -- | |
| Ullah Mohammed Hafiz | $245,000 | -- | |
| Ullah Mohammed Hafiz | $245,000 | -- | |
| Layne Harriette | -- | -- | |
| Layne Harriette | -- | -- | |
| Salmon Marcia Dianna Frith | $200,000 | -- | |
| Salmon Marcia Dianna Frith | $200,000 | -- | |
| Chief Home Investment Corp | $146,000 | -- | |
| Chief Home Investment Corp | $146,000 | -- | |
| Lewis Boncella | -- | -- | |
| Lewis Boncella | -- | -- |
Source: Public Records
Mortgage History
| Date | Status | Borrower | Loan Amount |
|---|---|---|---|
| Previous Owner | Mckenna Andre | $357,918 | |
| Previous Owner | Griffith Sherwin | $392,000 | |
| Previous Owner | Evans Joyce | $398,000 | |
| Previous Owner | Ullah Mohammed Hafiz | $220,500 | |
| Previous Owner | Layne Harriette | $212,000 | |
| Previous Owner | Salmon Marcia Dianna Frith | $197,395 |
Source: Public Records
Tax History
| Year | Tax Paid | Tax Assessment Tax Assessment Total Assessment is a certain percentage of the fair market value that is determined by local assessors to be the total taxable value of land and additions on the property. | Land | Improvement |
|---|---|---|---|---|
| 2025 | $5,692 | $39,720 | $17,160 | $22,560 |
| 2024 | $5,692 | $36,060 | $17,160 | $18,900 |
| 2023 | $5,755 | $44,040 | $17,160 | $26,880 |
| 2022 | $5,614 | $36,480 | $17,160 | $19,320 |
| 2021 | $5,584 | $32,220 | $17,160 | $15,060 |
| 2020 | $2,619 | $34,860 | $17,160 | $17,700 |
| 2019 | $4,940 | $36,540 | $17,160 | $19,380 |
| 2018 | $4,814 | $23,616 | $12,890 | $10,726 |
| 2017 | $4,778 | $23,437 | $16,799 | $6,638 |
| 2016 | $4,420 | $22,111 | $17,045 | $5,066 |
| 2015 | $2,806 | $20,860 | $14,225 | $6,635 |
| 2014 | $2,806 | $19,680 | $14,280 | $5,400 |
Source: Public Records
Map
Nearby Homes
- 891 Linden Blvd
- 980 Lenox Rd
- 890 Linden Blvd
- 886 Linden Blvd Unit 888
- 871 Linden Blvd
- 175 E 55th St
- 27 E 56th St
- 336 E 91st St Unit 4
- 179 E 54th St
- 895 Lenox Rd
- 323 E 91st St
- 1040 Willmohr St
- 5749 Kings Hwy
- 234 E 54th St
- 91 E 54th St Unit 2-R
- 227 E 56th St
- 5319 Church Ave
- 206 E 53rd St
- 5727 Kings Hwy
- 26 E 55th St
Your Personal Tour Guide
Ask me questions while you tour the home.