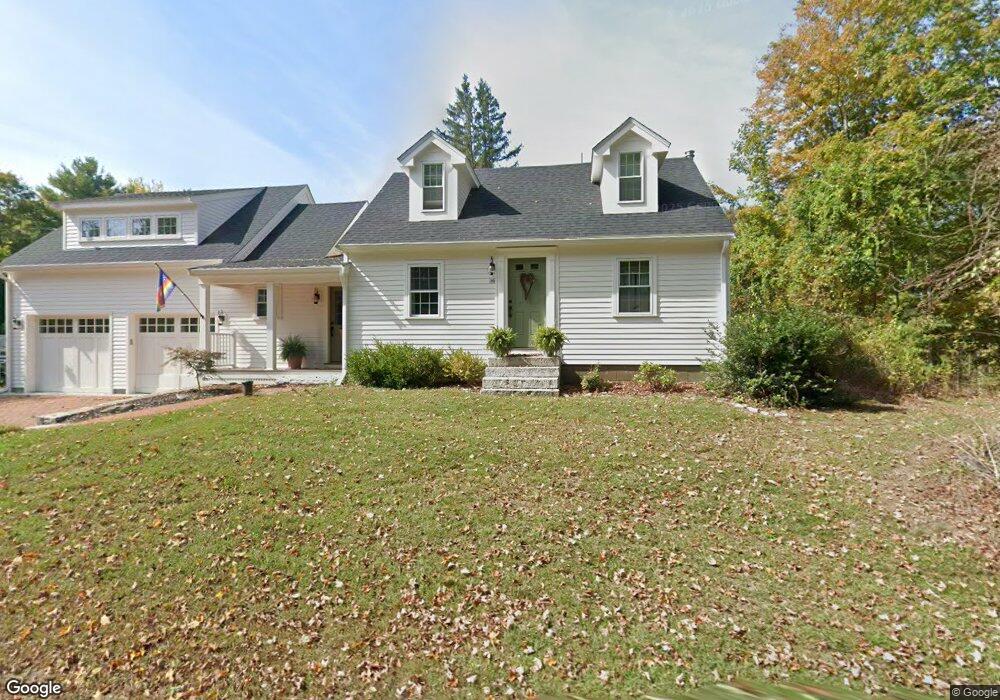
36 E End Rd Bolton, MA 01740
Estimated Value: $558,715 - $589,000
3
Beds
1
Bath
1,087
Sq Ft
$528/Sq Ft
Est. Value
About This Home
This home is located at 36 E End Rd, Bolton, MA 01740 and is currently estimated at $573,929, approximately $527 per square foot. 36 E End Rd is a home located in Worcester County with nearby schools including Florence Sawyer School, Nashoba Regional High School, and Darnell School For Educational & Behavioral Service.
Ownership History
Date
Name
Owned For
Owner Type
Purchase Details
Closed on
Jan 10, 2024
Sold by
Gleason Glenn
Bought by
Gleason Glenn and Hart Anne L
Current Estimated Value
Purchase Details
Closed on
Nov 4, 2010
Sold by
Smith Jeffrey P and Smith Elizabeth J
Bought by
Gleason Glenn G
Home Financials for this Owner
Home Financials are based on the most recent Mortgage that was taken out on this home.
Original Mortgage
$218,533
Interest Rate
4.41%
Mortgage Type
Purchase Money Mortgage
Purchase Details
Closed on
Jan 9, 2008
Sold by
Jaaskela Thomas Tauno and Jaaskela Valia M
Bought by
Ayres Elizabeth J and Smith Jeffrey P
Home Financials for this Owner
Home Financials are based on the most recent Mortgage that was taken out on this home.
Original Mortgage
$224,000
Interest Rate
6.21%
Mortgage Type
Purchase Money Mortgage
Create a Home Valuation Report for This Property
The Home Valuation Report is an in-depth analysis detailing your home's value as well as a comparison with similar homes in the area
Home Values in the Area
Average Home Value in this Area
Purchase History
| Date | Buyer | Sale Price | Title Company |
|---|---|---|---|
| Gleason Glenn | -- | None Available | |
| Gleason Glenn G | $273,167 | -- | |
| Ayres Elizabeth J | $277,500 | -- |
Source: Public Records
Mortgage History
| Date | Status | Borrower | Loan Amount |
|---|---|---|---|
| Previous Owner | Gleason Glenn G | $218,533 | |
| Previous Owner | Ayres Elizabeth J | $224,000 |
Source: Public Records
Tax History
| Year | Tax Paid | Tax Assessment Tax Assessment Total Assessment is a certain percentage of the fair market value that is determined by local assessors to be the total taxable value of land and additions on the property. | Land | Improvement |
|---|---|---|---|---|
| 2025 | $7,946 | $478,100 | $192,700 | $285,400 |
| 2024 | $7,192 | $442,300 | $177,900 | $264,400 |
| 2023 | $7,035 | $402,000 | $177,900 | $224,100 |
| 2022 | $6,764 | $340,400 | $168,100 | $172,300 |
| 2021 | $6,723 | $322,300 | $168,100 | $154,200 |
| 2020 | $6,590 | $323,200 | $167,900 | $155,300 |
| 2019 | $5,764 | $281,600 | $163,100 | $118,500 |
| 2018 | $5,574 | $269,800 | $158,300 | $111,500 |
| 2017 | $5,427 | $256,000 | $153,500 | $102,500 |
| 2016 | $5,292 | $253,100 | $143,900 | $109,200 |
| 2015 | $4,974 | $237,100 | $134,300 | $102,800 |
| 2014 | $5,152 | $243,000 | $148,700 | $94,300 |
Source: Public Records
Map
Nearby Homes
- 98 Meadow Rd
- 90 Corn Rd
- 53 Sylvan Dr
- 13 Pine Hill Way
- 18 B Pine Hill Way Unit BB
- 16 A Pine Hill Way Unit 16AA
- 14 Pine Hill Way
- 54 Orchard Dr Unit 54
- 0 Long Hill Rd
- 47 Sugar Rd
- 28 Mcintosh Dr
- 143 Hudson Rd
- 94 Hudson Rd
- 11 Quail Run
- 19 Partridge Hill Rd
- 555 Old Harvard Rd
- 90 Harvard Rd
- 54 Main St
- 399 Long Hill Rd
- 265 Manning St
- 26 E End Rd
- 19 E End Rd
- 49 E End Rd
- 58 E End Rd
- 10 Harris Farm Rd
- 20 E End Rd
- 607 Sugar Rd
- 53 E End Rd
- 3 E End Rd
- 115 Main St
- 1 Lt 1a Harris Farm Rd
- 7 Lt 7a Harris Farm Rd
- 2 Lt 2 Harris Farm Rd
- 6 L 6a Harris Farm Rd
- 5 Lot 5a Harris Farm Rd
- 8 Lot 8 Harris Farm Rd
- 4 L 4a Harris Farm Rd
- 66 E End Rd
- 66 E End Rd Unit 1
- 0 Main St
Your Personal Tour Guide
Ask me questions while you tour the home.