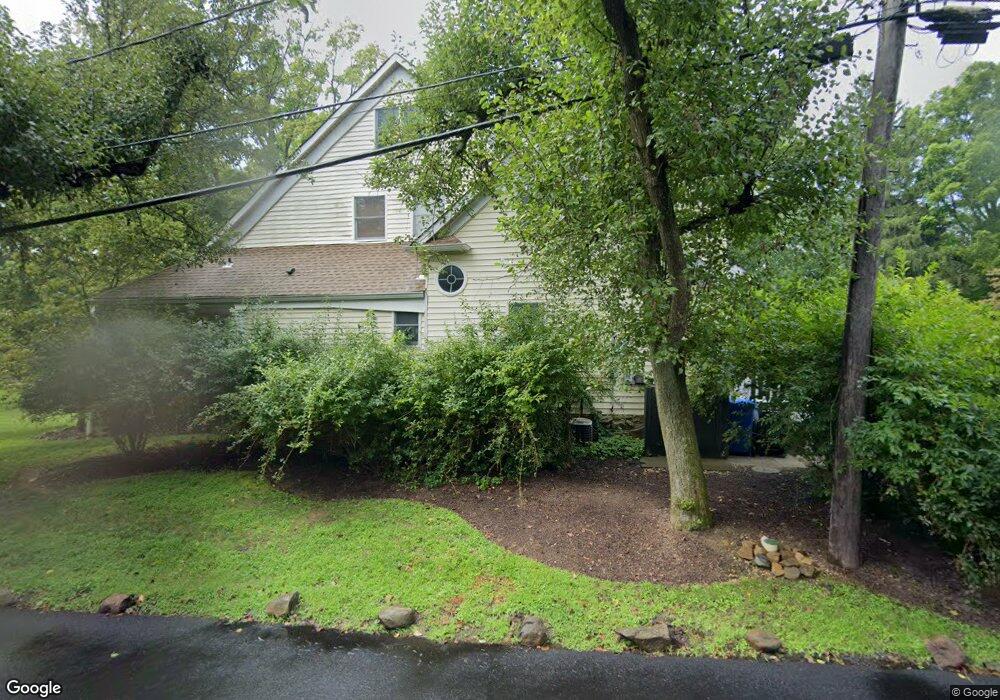
36 E Main St Mendham, NJ 07945
Estimated Value: $1,148,000 - $1,379,902
3
Beds
3
Baths
4,558
Sq Ft
$275/Sq Ft
Est. Value
About This Home
This home is located at 36 E Main St, Mendham, NJ 07945 and is currently estimated at $1,254,226, approximately $275 per square foot. 36 E Main St is a home located in Morris County with nearby schools including Hilltop Elementary School, Mountain View Middle School, and West Morris Mendham High School.
Ownership History
Date
Name
Owned For
Owner Type
Purchase Details
Closed on
Sep 28, 2015
Sold by
Furgueson Michael Graham and Seabrook Kathy Ann
Bought by
Seabrook Kathy Ann
Current Estimated Value
Purchase Details
Closed on
Sep 5, 1996
Sold by
Salter Louis M and Salter Paula
Bought by
Sandilands Howard G and Sandilands Zofia H
Purchase Details
Closed on
Jan 11, 1995
Sold by
Arnold Thomas
Bought by
Furgueson Michael and Seabrook Kathy
Home Financials for this Owner
Home Financials are based on the most recent Mortgage that was taken out on this home.
Original Mortgage
$315,000
Interest Rate
9.23%
Create a Home Valuation Report for This Property
The Home Valuation Report is an in-depth analysis detailing your home's value as well as a comparison with similar homes in the area
Home Values in the Area
Average Home Value in this Area
Purchase History
| Date | Buyer | Sale Price | Title Company |
|---|---|---|---|
| Seabrook Kathy Ann | -- | None Available | |
| Sandilands Howard G | $420,000 | Chicago Title Insurance Co | |
| Furgueson Michael | $415,000 | -- |
Source: Public Records
Mortgage History
| Date | Status | Borrower | Loan Amount |
|---|---|---|---|
| Previous Owner | Furgueson Michael | $315,000 |
Source: Public Records
Tax History
| Year | Tax Paid | Tax Assessment Tax Assessment Total Assessment is a certain percentage of the fair market value that is determined by local assessors to be the total taxable value of land and additions on the property. | Land | Improvement |
|---|---|---|---|---|
| 2025 | $22,531 | $915,900 | $292,100 | $623,800 |
| 2024 | $22,476 | $915,900 | $292,100 | $623,800 |
Source: Public Records
Map
Nearby Homes
Your Personal Tour Guide
Ask me questions while you tour the home.