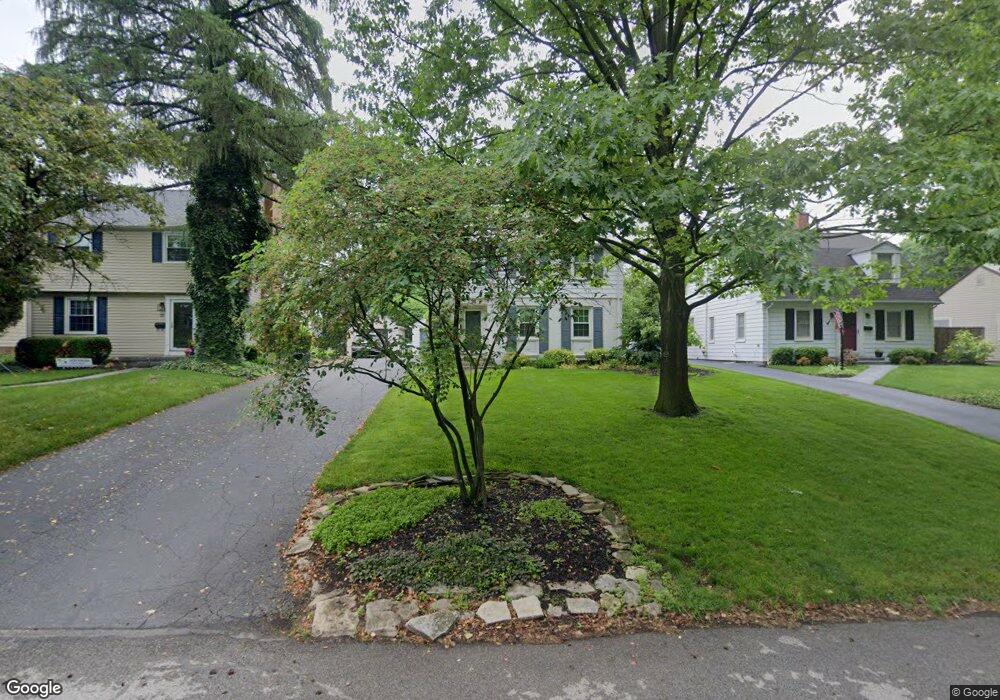
36 E Riverglen Dr Worthington, OH 43085
Estimated Value: $510,198 - $694,000
4
Beds
2
Baths
1,976
Sq Ft
$304/Sq Ft
Est. Value
About This Home
This home is located at 36 E Riverglen Dr, Worthington, OH 43085 and is currently estimated at $601,050, approximately $304 per square foot. 36 E Riverglen Dr is a home located in Franklin County with nearby schools including Colonial Hills Elementary School, Kilbourne Middle School, and Thomas Worthington High School.
Ownership History
Date
Name
Owned For
Owner Type
Purchase Details
Closed on
Aug 10, 2016
Sold by
Garvin Marilyn S
Bought by
Dy Kyle P and Dy Mandi L
Current Estimated Value
Home Financials for this Owner
Home Financials are based on the most recent Mortgage that was taken out on this home.
Original Mortgage
$244,400
Outstanding Balance
$192,487
Interest Rate
3.42%
Mortgage Type
New Conventional
Estimated Equity
$408,563
Purchase Details
Closed on
May 26, 2016
Sold by
Kristen Curry
Bought by
Dunkin Matthew and Blom Erica
Home Financials for this Owner
Home Financials are based on the most recent Mortgage that was taken out on this home.
Original Mortgage
$276,000
Interest Rate
3.64%
Purchase Details
Closed on
Oct 19, 1982
Bought by
Garvin Marilyn S
Create a Home Valuation Report for This Property
The Home Valuation Report is an in-depth analysis detailing your home's value as well as a comparison with similar homes in the area
Home Values in the Area
Average Home Value in this Area
Purchase History
| Date | Buyer | Sale Price | Title Company |
|---|---|---|---|
| Dy Kyle P | $305,500 | Northwest Select Title Agenc | |
| Dunkin Matthew | -- | -- | |
| Garvin Marilyn S | -- | -- |
Source: Public Records
Mortgage History
| Date | Status | Borrower | Loan Amount |
|---|---|---|---|
| Open | Dy Kyle P | $244,400 | |
| Previous Owner | Dunkin Matthew | $276,000 | |
| Previous Owner | Dunkin Matthew | -- |
Source: Public Records
Tax History
| Year | Tax Paid | Tax Assessment Tax Assessment Total Assessment is a certain percentage of the fair market value that is determined by local assessors to be the total taxable value of land and additions on the property. | Land | Improvement |
|---|---|---|---|---|
| 2025 | $10,695 | $139,450 | $43,930 | $95,520 |
| 2024 | $10,695 | $139,450 | $43,930 | $95,520 |
| 2023 | $10,317 | $139,440 | $43,925 | $95,515 |
| 2022 | $10,786 | $119,140 | $29,260 | $89,880 |
| 2021 | $10,104 | $119,140 | $29,260 | $89,880 |
| 2020 | $9,797 | $119,140 | $29,260 | $89,880 |
| 2019 | $9,516 | $103,890 | $25,450 | $78,440 |
| 2018 | $8,608 | $103,890 | $25,450 | $78,440 |
| 2017 | $9,015 | $103,890 | $25,450 | $78,440 |
| 2016 | $7,956 | $92,050 | $24,150 | $67,900 |
| 2015 | $7,937 | $92,050 | $24,150 | $67,900 |
| 2014 | $6,355 | $92,050 | $24,150 | $67,900 |
| 2013 | $2,861 | $83,685 | $21,945 | $61,740 |
Source: Public Records
Map
Nearby Homes
- 94 W Riverglen Dr
- 5818 Crescent Ct
- 5733 N High St
- 5795 Foster Ave
- 40 Chase Rd
- 649 High St Unit 202
- 119 E Lincoln Ave
- 131 E Stanton Ave
- 242 W New England Ave
- 5821 Olentangy Blvd
- 131 Broad Meadows Blvd
- 33 Rosslyn Ave
- 468 E Lincoln Ave
- 563 Loveman Ave
- 569 Loveman Ave
- 68 W Kanawha Ave
- 587 Kenbrook Dr
- 547 Chase Rd
- 252 W Kanawha Ave
- 627 S Selby Blvd
- 36 E Riverglen Dr
- 28 E Riverglen Dr
- 42 E Riverglen Dr
- 32 E Riverglen Dr
- 48 E Riverglen Dr
- 62 E Riverglen Dr
- 62 E Riverglen Dr
- 62 Glen Dr Unit 62
- 37 E Riverglen Dr
- 27 E Riverglen Dr
- 27 E Riverglen Dr Unit a
- 33 Orchard Dr
- 39 Orchard Dr
- 27 Orchard Dr
- 45 E Riverglen Dr
- 5844 N High St
- 47 Orchard Dr
- 21 Orchard Dr
- 5830 N High St
- 51 E Riverglen Dr
Your Personal Tour Guide
Ask me questions while you tour the home.