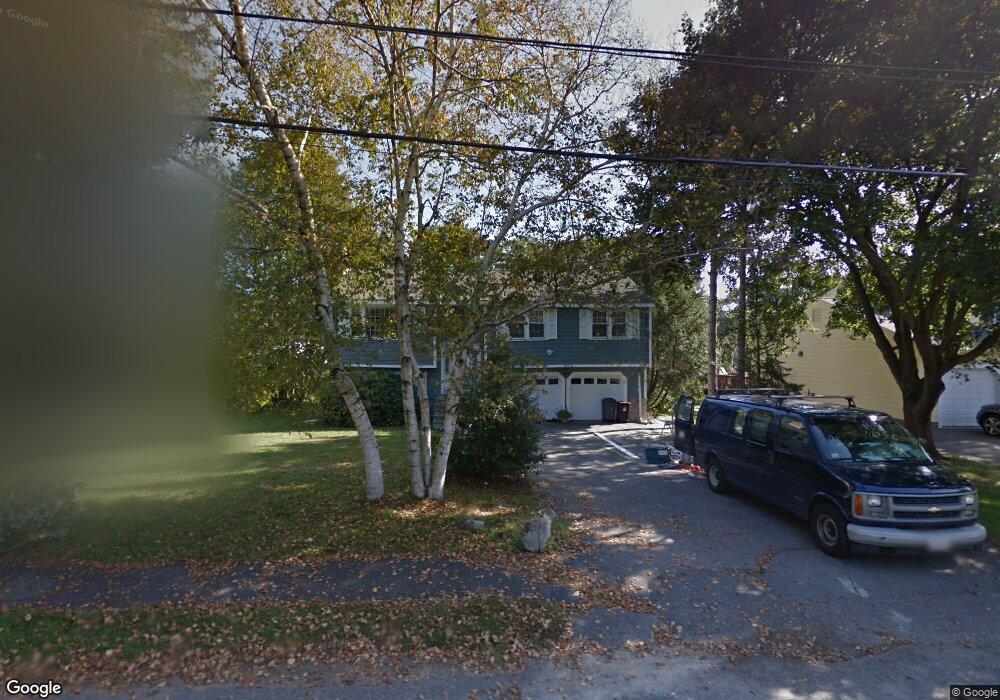
36 Falcon St Needham, MA 02492
Estimated Value: $1,433,000 - $1,585,000
4
Beds
3
Baths
2,668
Sq Ft
$564/Sq Ft
Est. Value
About This Home
This home is located at 36 Falcon St, Needham, MA 02492 and is currently estimated at $1,503,557, approximately $563 per square foot. 36 Falcon St is a home located in Norfolk County with nearby schools including Mitchell Elementary School, High Rock Middle School, and Pollard Middle School.
Ownership History
Date
Name
Owned For
Owner Type
Purchase Details
Closed on
Jun 29, 2001
Sold by
Huang Taosheng
Bought by
Mccarthy Michael J and Mccarthy Anne M
Current Estimated Value
Purchase Details
Closed on
Aug 13, 1999
Sold by
Mieling Georg H and Mieling Anne
Bought by
Huang Taosheng and Su Kui
Purchase Details
Closed on
May 31, 1996
Sold by
Anderson Duncan W and Anderson Margaret
Bought by
Mieling Georg H and Mieling Anne
Create a Home Valuation Report for This Property
The Home Valuation Report is an in-depth analysis detailing your home's value as well as a comparison with similar homes in the area
Home Values in the Area
Average Home Value in this Area
Purchase History
| Date | Buyer | Sale Price | Title Company |
|---|---|---|---|
| Mccarthy Michael J | $530,000 | -- | |
| Huang Taosheng | $375,000 | -- | |
| Mieling Georg H | $305,000 | -- | |
| Mieling Georg H | $305,000 | -- |
Source: Public Records
Mortgage History
| Date | Status | Borrower | Loan Amount |
|---|---|---|---|
| Open | Mieling Georg H | $100,000 | |
| Open | Mieling Georg H | $238,200 |
Source: Public Records
Tax History
| Year | Tax Paid | Tax Assessment Tax Assessment Total Assessment is a certain percentage of the fair market value that is determined by local assessors to be the total taxable value of land and additions on the property. | Land | Improvement |
|---|---|---|---|---|
| 2025 | $13,655 | $1,288,200 | $776,500 | $511,700 |
| 2024 | $13,033 | $1,041,000 | $554,600 | $486,400 |
| 2023 | $13,092 | $1,004,000 | $554,600 | $449,400 |
| 2022 | $12,271 | $917,800 | $486,800 | $431,000 |
| 2021 | $11,959 | $917,800 | $486,800 | $431,000 |
| 2020 | $11,787 | $943,700 | $486,800 | $456,900 |
| 2019 | $11,074 | $893,800 | $442,800 | $451,000 |
| 2018 | $10,618 | $893,800 | $442,800 | $451,000 |
| 2017 | $9,929 | $835,100 | $442,800 | $392,300 |
| 2016 | $9,687 | $839,400 | $442,800 | $396,600 |
| 2015 | $9,477 | $839,400 | $442,800 | $396,600 |
| 2014 | $9,190 | $789,500 | $402,800 | $386,700 |
Source: Public Records
Map
Nearby Homes
- 68 Brookline St
- 190 Brookline St
- 17 Lindbergh Ave
- 176 Highgate St
- 638 Webster St
- 638 Webster St Unit 638
- 510 Webster St
- 31 Birds Hill Ave
- 143 Hunting Rd
- 40 High St
- 36 Otis St Unit 36
- 24 Mellen St
- 7 West St
- 5 Hazel Ln
- 58 Morton St
- 28 Mercer Rd
- 100 Woodbine Cir
- 108 Woodbine Cir
- 19 Oakland Ave Unit 19
- 126 Prince St
Your Personal Tour Guide
Ask me questions while you tour the home.