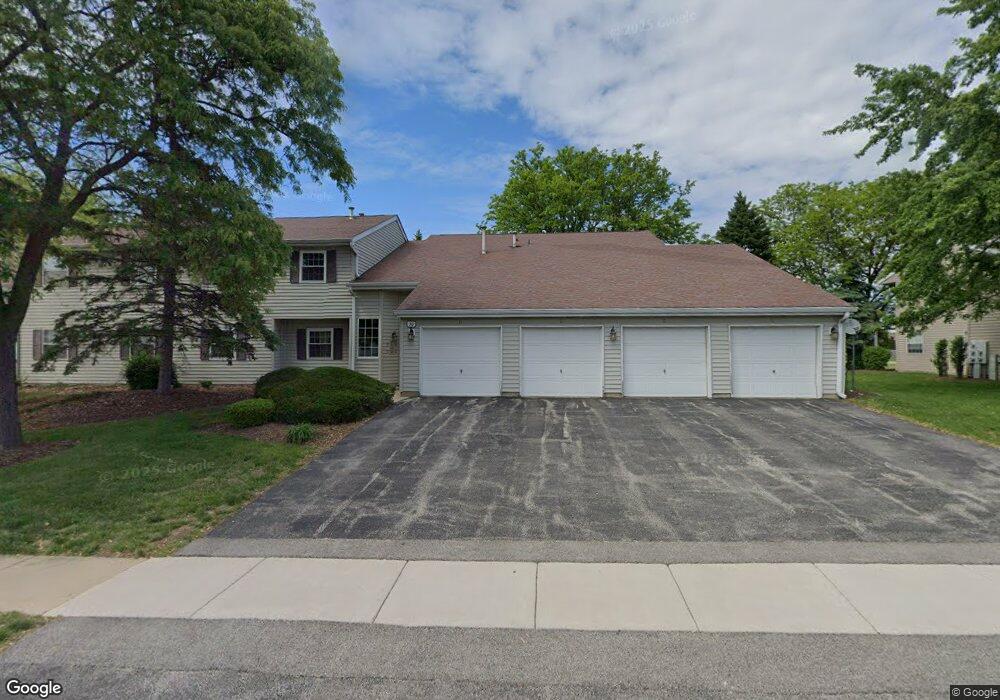
36 Gant Cir Unit 36C Streamwood, IL 60107
Estimated Value: $170,000 - $173,000
1
Bed
--
Bath
900
Sq Ft
$191/Sq Ft
Est. Value
About This Home
This home is located at 36 Gant Cir Unit 36C, Streamwood, IL 60107 and is currently estimated at $171,560, approximately $190 per square foot. 36 Gant Cir Unit 36C is a home located in Cook County with nearby schools including Glenbrook Elementary School, Canton Middle School, and Streamwood High School.
Ownership History
Date
Name
Owned For
Owner Type
Purchase Details
Closed on
Jul 17, 2022
Sold by
Ama Fnn Llc
Bought by
Kuras Paulina and Kuras Wojciech
Current Estimated Value
Home Financials for this Owner
Home Financials are based on the most recent Mortgage that was taken out on this home.
Original Mortgage
$107,200
Interest Rate
6.25%
Mortgage Type
New Conventional
Purchase Details
Closed on
Apr 25, 2017
Sold by
Maksymovych Oleg and Maksymovych Tatyana
Bought by
Aamfhh Llc
Purchase Details
Closed on
Apr 21, 2010
Sold by
Losowy Alexandra
Bought by
Losowy Alexandra and Maksymovych Oleg
Purchase Details
Closed on
Oct 18, 2005
Sold by
Victorian Streamwood Llc
Bought by
Losowy Alexandra
Home Financials for this Owner
Home Financials are based on the most recent Mortgage that was taken out on this home.
Original Mortgage
$101,150
Interest Rate
6.75%
Mortgage Type
Purchase Money Mortgage
Create a Home Valuation Report for This Property
The Home Valuation Report is an in-depth analysis detailing your home's value as well as a comparison with similar homes in the area
Home Values in the Area
Average Home Value in this Area
Purchase History
| Date | Buyer | Sale Price | Title Company |
|---|---|---|---|
| Kuras Paulina | $134,000 | Fidelity National Title | |
| Aamfhh Llc | -- | None Available | |
| Losowy Alexandra | -- | None Available | |
| Losowy Alexandra | $135,000 | Chicago Title Insurance Comp |
Source: Public Records
Mortgage History
| Date | Status | Borrower | Loan Amount |
|---|---|---|---|
| Previous Owner | Kuras Paulina | $107,200 | |
| Previous Owner | Losowy Alexandra | $101,150 |
Source: Public Records
Tax History Compared to Growth
Tax History
| Year | Tax Paid | Tax Assessment Tax Assessment Total Assessment is a certain percentage of the fair market value that is determined by local assessors to be the total taxable value of land and additions on the property. | Land | Improvement |
|---|---|---|---|---|
| 2024 | $2,719 | $8,828 | $578 | $8,250 |
| 2023 | $2,648 | $8,828 | $578 | $8,250 |
| 2022 | $2,648 | $8,828 | $578 | $8,250 |
| 2021 | $2,502 | $6,844 | $3,217 | $3,627 |
| 2020 | $2,460 | $6,844 | $3,217 | $3,627 |
| 2019 | $2,452 | $7,675 | $3,217 | $4,458 |
| 2018 | $2,088 | $5,928 | $2,805 | $3,123 |
| 2017 | $2,059 | $5,928 | $2,805 | $3,123 |
| 2016 | $1,920 | $5,928 | $2,805 | $3,123 |
| 2015 | $1,444 | $4,071 | $2,475 | $1,596 |
| 2014 | $1,422 | $4,071 | $2,475 | $1,596 |
| 2013 | $1,378 | $4,071 | $2,475 | $1,596 |
Source: Public Records
Map
Nearby Homes
- 105 Abbeywood Cir
- 340 Somerset Dr
- 520 Dana Ln
- 48 N Victoria Ln Unit B
- 318 Exmoor Dr
- 701 Garden Cir Unit 3
- 28 Chaucer Ln
- 5 Canterbury Ct
- 211 N Oltendorf Rd
- 412 Audubon Rd
- 295 Chrisman Dr
- 317 E Schaumburg Rd
- 28 N Oltendorf Rd
- 7 Marion Ln
- 4 Haverton Ct Unit 2003
- 27 Ridge Cir
- 102 Grow Ln
- 125 Seton Place
- 120 Grow Ln
- 206 Ridge Cir
- 36 Gant Cir Unit 36D
- 36 Gant Cir Unit 36E
- 36 Gant Cir Unit 36H
- 36 Gant Cir Unit 36G
- 36 Gant Cir Unit 36B
- 36 Gant Cir Unit 36F
- 36 Gant Cir Unit 36A
- 36 Gant Cir Unit H
- 36 Gant Cir Unit C
- 36 Gant Cir Unit B
- 36 Gant Cir Unit G
- 36 Gant Cir Unit A
- 46 Gant Cir Unit 46D
- 46 Gant Cir Unit 46E
- 46 Gant Cir Unit 46H
- 46 Gant Cir Unit 46F
- 46 Gant Cir Unit 46A
- 46 Gant Cir Unit 46G
- 46 Gant Cir Unit 46B
- 46 Gant Cir Unit 46C