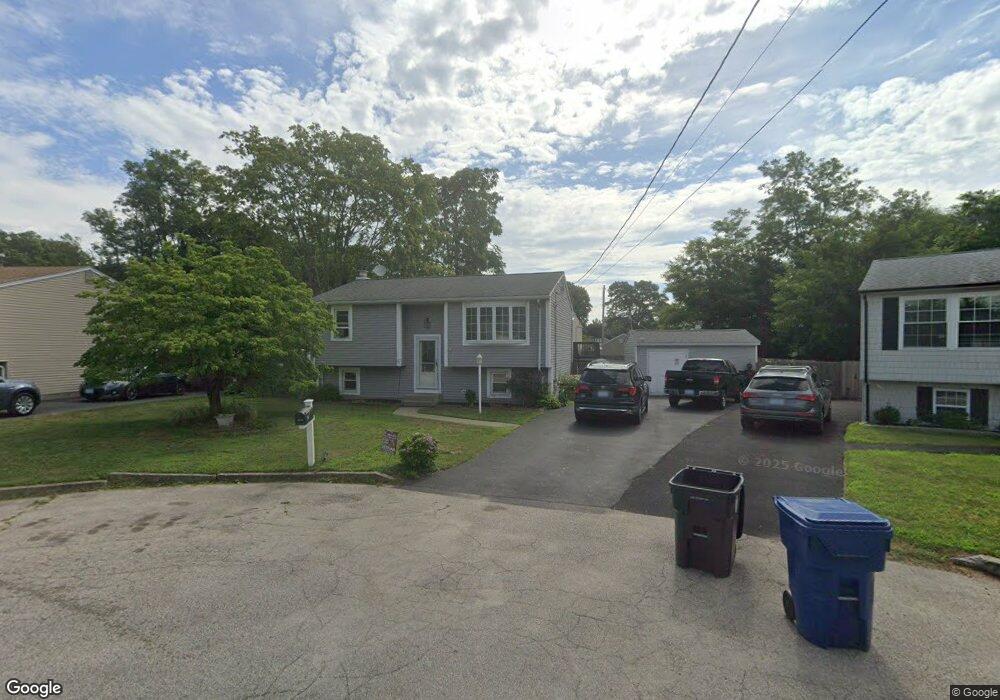
36 Gateway Ct Warwick, RI 02889
Hoxie NeighborhoodEstimated Value: $380,900 - $459,000
3
Beds
1
Bath
1,428
Sq Ft
$298/Sq Ft
Est. Value
About This Home
This home is located at 36 Gateway Ct, Warwick, RI 02889 and is currently estimated at $425,225, approximately $297 per square foot. 36 Gateway Ct is a home located in Kent County with nearby schools including Saint Kevin School and Bishop Hendricken High School.
Ownership History
Date
Name
Owned For
Owner Type
Purchase Details
Closed on
Jun 18, 2004
Sold by
Loiselle Mark J and Loiselle Karen A
Bought by
Anderson Rober
Current Estimated Value
Home Financials for this Owner
Home Financials are based on the most recent Mortgage that was taken out on this home.
Original Mortgage
$226,495
Interest Rate
6.12%
Mortgage Type
Purchase Money Mortgage
Purchase Details
Closed on
Sep 22, 1989
Sold by
Fogarty Kenneth J
Bought by
Loiselle Mark J
Create a Home Valuation Report for This Property
The Home Valuation Report is an in-depth analysis detailing your home's value as well as a comparison with similar homes in the area
Home Values in the Area
Average Home Value in this Area
Purchase History
| Date | Buyer | Sale Price | Title Company |
|---|---|---|---|
| Anderson Rober | $233,500 | -- | |
| Loiselle Mark J | $113,000 | -- | |
| Loiselle Mark J | $113,000 | -- |
Source: Public Records
Mortgage History
| Date | Status | Borrower | Loan Amount |
|---|---|---|---|
| Open | Loiselle Mark J | $203,200 | |
| Closed | Loiselle Mark J | $226,495 | |
| Previous Owner | Loiselle Mark J | $85,000 |
Source: Public Records
Tax History
| Year | Tax Paid | Tax Assessment Tax Assessment Total Assessment is a certain percentage of the fair market value that is determined by local assessors to be the total taxable value of land and additions on the property. | Land | Improvement |
|---|---|---|---|---|
| 2025 | $4,484 | $353,100 | $107,600 | $245,500 |
| 2024 | $4,347 | $300,400 | $93,500 | $206,900 |
| 2023 | $4,263 | $300,400 | $93,500 | $206,900 |
| 2022 | $4,203 | $224,400 | $66,300 | $158,100 |
| 2021 | $4,203 | $224,400 | $66,300 | $158,100 |
| 2020 | $4,203 | $224,400 | $66,300 | $158,100 |
| 2019 | $4,203 | $224,400 | $66,300 | $158,100 |
| 2018 | $3,723 | $179,000 | $66,300 | $112,700 |
| 2017 | $3,623 | $179,000 | $66,300 | $112,700 |
| 2016 | $3,623 | $179,000 | $66,300 | $112,700 |
| 2015 | $3,285 | $158,300 | $59,200 | $99,100 |
| 2014 | $3,175 | $158,300 | $59,200 | $99,100 |
| 2013 | $3,133 | $158,300 | $59,200 | $99,100 |
Source: Public Records
Map
Nearby Homes
Your Personal Tour Guide
Ask me questions while you tour the home.