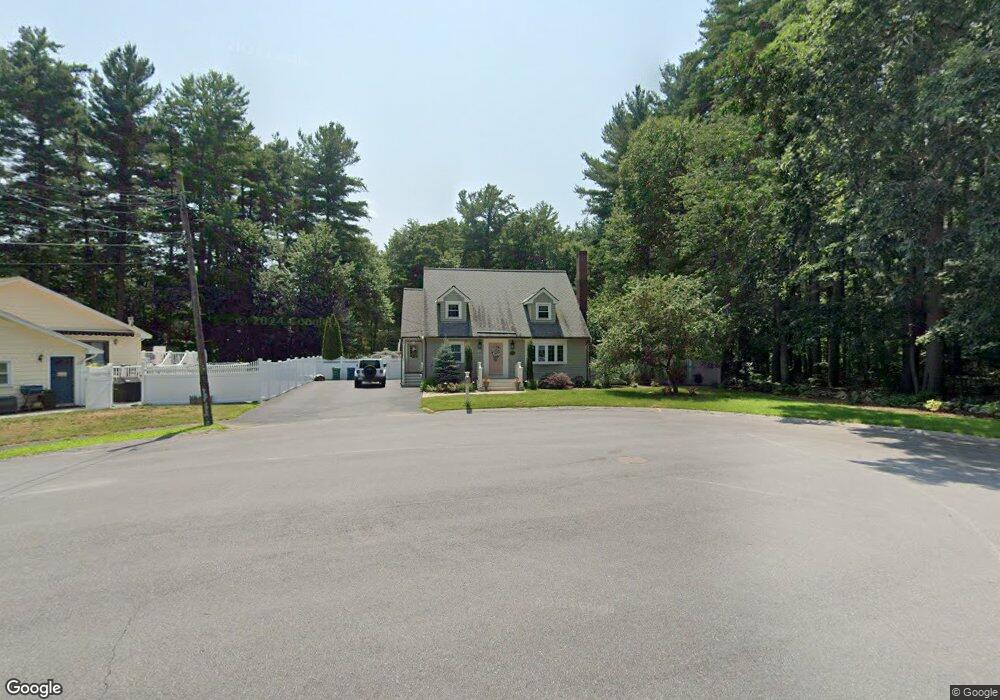
36 Gedick Rd Burlington, MA 01803
North Burlington NeighborhoodEstimated Value: $858,000 - $1,148,000
4
Beds
2
Baths
1,860
Sq Ft
$537/Sq Ft
Est. Value
About This Home
This home is located at 36 Gedick Rd, Burlington, MA 01803 and is currently estimated at $999,667, approximately $537 per square foot. 36 Gedick Rd is a home located in Middlesex County with nearby schools including Burlington High School, Fox Hill, and Marshall Simonds Middle School.
Ownership History
Date
Name
Owned For
Owner Type
Purchase Details
Closed on
Feb 15, 1996
Sold by
Casey Virginia and Evans Gerald
Bought by
Gilberg Marybeth
Current Estimated Value
Purchase Details
Closed on
Dec 14, 1988
Sold by
Moran Michael K
Bought by
Casey Virginia
Create a Home Valuation Report for This Property
The Home Valuation Report is an in-depth analysis detailing your home's value as well as a comparison with similar homes in the area
Home Values in the Area
Average Home Value in this Area
Purchase History
| Date | Buyer | Sale Price | Title Company |
|---|---|---|---|
| Gilberg Marybeth | $208,000 | -- | |
| Casey Virginia | $205,000 | -- |
Source: Public Records
Mortgage History
| Date | Status | Borrower | Loan Amount |
|---|---|---|---|
| Open | Casey Virginia | $386,000 | |
| Closed | Casey Virginia | $399,000 |
Source: Public Records
Tax History
| Year | Tax Paid | Tax Assessment Tax Assessment Total Assessment is a certain percentage of the fair market value that is determined by local assessors to be the total taxable value of land and additions on the property. | Land | Improvement |
|---|---|---|---|---|
| 2025 | $6,920 | $799,100 | $399,300 | $399,800 |
| 2024 | $6,967 | $779,300 | $378,600 | $400,700 |
| 2023 | $6,787 | $722,000 | $328,800 | $393,200 |
| 2022 | $6,570 | $660,300 | $299,700 | $360,600 |
| 2021 | $6,749 | $633,100 | $272,500 | $360,600 |
| 2020 | $6,113 | $634,100 | $272,500 | $361,600 |
| 2019 | $5,999 | $572,400 | $254,600 | $317,800 |
| 2018 | $4,646 | $546,300 | $242,400 | $303,900 |
| 2017 | $5,746 | $546,300 | $242,400 | $303,900 |
| 2016 | $5,711 | $498,300 | $206,700 | $291,600 |
| 2015 | $5,656 | $498,300 | $206,700 | $291,600 |
| 2014 | $5,561 | $463,400 | $187,900 | $275,500 |
Source: Public Records
Map
Nearby Homes
- 2 Stephanie St
- 6 Glade St
- 14 Sarah St
- 0 Bedford St
- 41 Glenvale Ave
- 17 Glenvale Ave
- 29 Beaverbrook Rd
- 12 Ridgeway Ave
- 10 Moss St
- 20 Alma Rd
- 23 Wilmington Rd
- 255 Burlington Ave
- 23 County Rd
- 23 Rocky Hill Rd
- 9 Pinegrove Ave
- 345 Cambridge St
- 224 Burlington Ave
- 220 Burlington Ave
- 6 Patricia Cir
- 3 Memory Ln
Your Personal Tour Guide
Ask me questions while you tour the home.