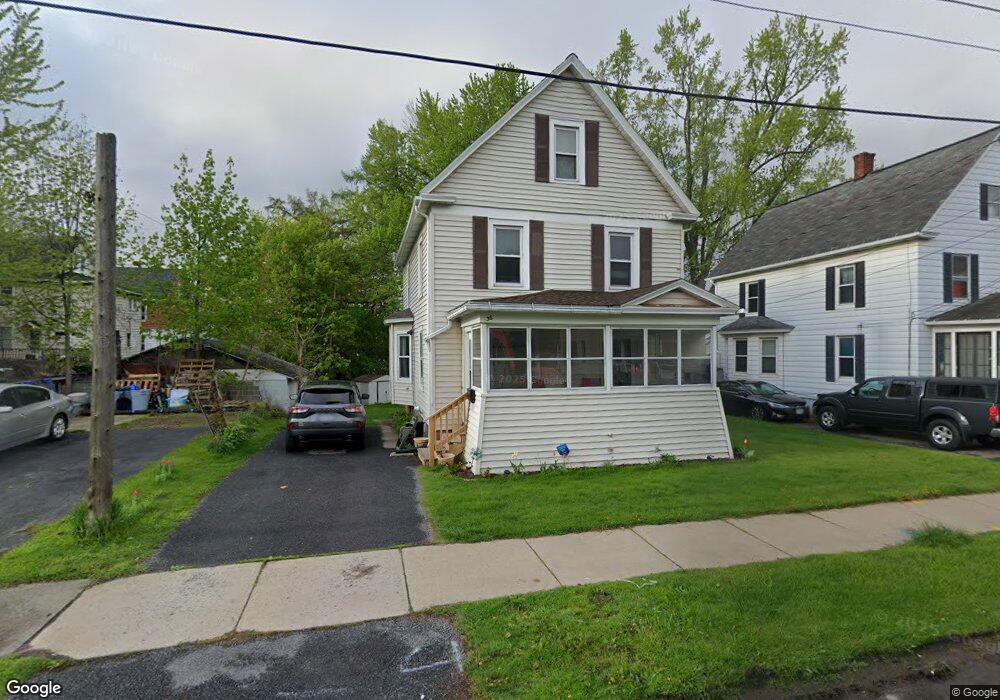
36 George St Binghamton, NY 13904
Eastside Binghamton NeighborhoodEstimated Value: $125,000 - $152,000
3
Beds
1
Bath
1,397
Sq Ft
$99/Sq Ft
Est. Value
About This Home
This home is located at 36 George St, Binghamton, NY 13904 and is currently estimated at $138,337, approximately $99 per square foot. 36 George St is a home located in Broome County with nearby schools including Calvin Coolidge Elementary School, Binghamton High School, and East Middle School.
Ownership History
Date
Name
Owned For
Owner Type
Purchase Details
Closed on
Jan 14, 2011
Sold by
Pierce Jeffrey L and Pierce Teresa A
Bought by
Jefferson Joan M
Current Estimated Value
Home Financials for this Owner
Home Financials are based on the most recent Mortgage that was taken out on this home.
Original Mortgage
$72,030
Interest Rate
5.12%
Mortgage Type
FHA
Purchase Details
Closed on
Apr 21, 2008
Sold by
Bozewicz Eleanor
Bought by
Pierce Jeffrey
Create a Home Valuation Report for This Property
The Home Valuation Report is an in-depth analysis detailing your home's value as well as a comparison with similar homes in the area
Home Values in the Area
Average Home Value in this Area
Purchase History
| Date | Buyer | Sale Price | Title Company |
|---|---|---|---|
| Jefferson Joan M | $74,800 | None Available | |
| Pierce Jeffrey | $60,000 | Robert Wedlake |
Source: Public Records
Mortgage History
| Date | Status | Borrower | Loan Amount |
|---|---|---|---|
| Previous Owner | Jefferson Joan M | $72,030 |
Source: Public Records
Tax History
| Year | Tax Paid | Tax Assessment Tax Assessment Total Assessment is a certain percentage of the fair market value that is determined by local assessors to be the total taxable value of land and additions on the property. | Land | Improvement |
|---|---|---|---|---|
| 2024 | $6,652 | $67,500 | $10,900 | $56,600 |
| 2023 | $6,531 | $67,500 | $10,900 | $56,600 |
| 2022 | $6,378 | $67,500 | $10,900 | $56,600 |
| 2021 | $6,306 | $67,500 | $10,900 | $56,600 |
| 2020 | $3,499 | $67,500 | $10,900 | $56,600 |
| 2019 | $2,128 | $67,500 | $10,900 | $56,600 |
| 2018 | $3,395 | $67,500 | $10,900 | $56,600 |
| 2017 | $3,429 | $67,500 | $10,900 | $56,600 |
| 2016 | $3,458 | $67,500 | $10,900 | $56,600 |
| 2015 | $3,646 | $67,500 | $10,900 | $56,600 |
| 2014 | $3,646 | $67,500 | $10,900 | $56,600 |
Source: Public Records
Map
Nearby Homes
Your Personal Tour Guide
Ask me questions while you tour the home.