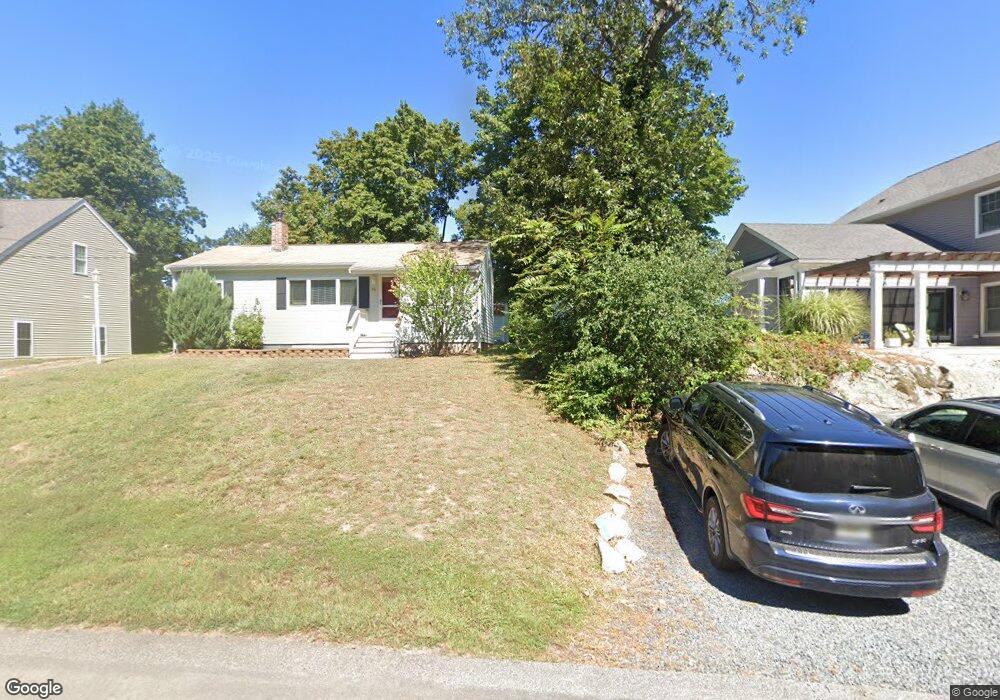
36 Gilford Rd Unit 1 Hingham, MA 02043
Estimated Value: $507,000 - $827,000
2
Beds
1
Bath
951
Sq Ft
$642/Sq Ft
Est. Value
About This Home
This home is located at 36 Gilford Rd Unit 1, Hingham, MA 02043 and is currently estimated at $610,329, approximately $641 per square foot. 36 Gilford Rd Unit 1 is a home located in Plymouth County with nearby schools including East Elementary School, Hingham Middle School, and Hingham High School.
Ownership History
Date
Name
Owned For
Owner Type
Purchase Details
Closed on
Jul 28, 2025
Sold by
Hersey Myrla E
Bought by
Poulson Carla and Poulson Marc
Current Estimated Value
Purchase Details
Closed on
Oct 28, 2014
Sold by
Hersey Galen H and Hersey Myrla E
Bought by
Hersey Myrla E
Purchase Details
Closed on
Jun 24, 2009
Sold by
Gullicksen Norman C
Bought by
Hersey Galen H and Hersey Myria E
Create a Home Valuation Report for This Property
The Home Valuation Report is an in-depth analysis detailing your home's value as well as a comparison with similar homes in the area
Purchase History
| Date | Buyer | Sale Price | Title Company |
|---|---|---|---|
| Poulson Carla | $500,000 | -- | |
| Hersey Myrla E | -- | -- | |
| Hersey Myrla E | -- | -- | |
| Hersey Myrla E | -- | -- | |
| Hersey Galen H | $100,000 | -- | |
| Hersey Galen H | $100,000 | -- |
Source: Public Records
Mortgage History
| Date | Status | Borrower | Loan Amount |
|---|---|---|---|
| Previous Owner | Hersey Galen H | $40,000 |
Source: Public Records
Map
Nearby Homes
- 112 Martins Ln
- 8 Evergreen Ln
- 3 Evergreen Ln
- 1 Rockland St
- 101 Rockland St
- LOT 1B Rockland St
- 155 George Washington Blvd Unit 210
- 9 Barnes Rd
- 2 Cliff Rd
- 15 Lincoln Ave
- 127 Hampton Cir
- 23 Wyola Rd
- 9 Park Ave Unit 202
- 22 Berkley Rd Unit B
- 3 3rd St
- 4 Atherton Rd
- 121 Nantasket Ave Unit 503
- 114 Hull St
- 99 Nantasket Ave
- 166 Hull St
Your Personal Tour Guide
Ask me questions while you tour the home.