Estimated Value: $262,000 - $310,000
3
Beds
1
Bath
1,204
Sq Ft
$236/Sq Ft
Est. Value
About This Home
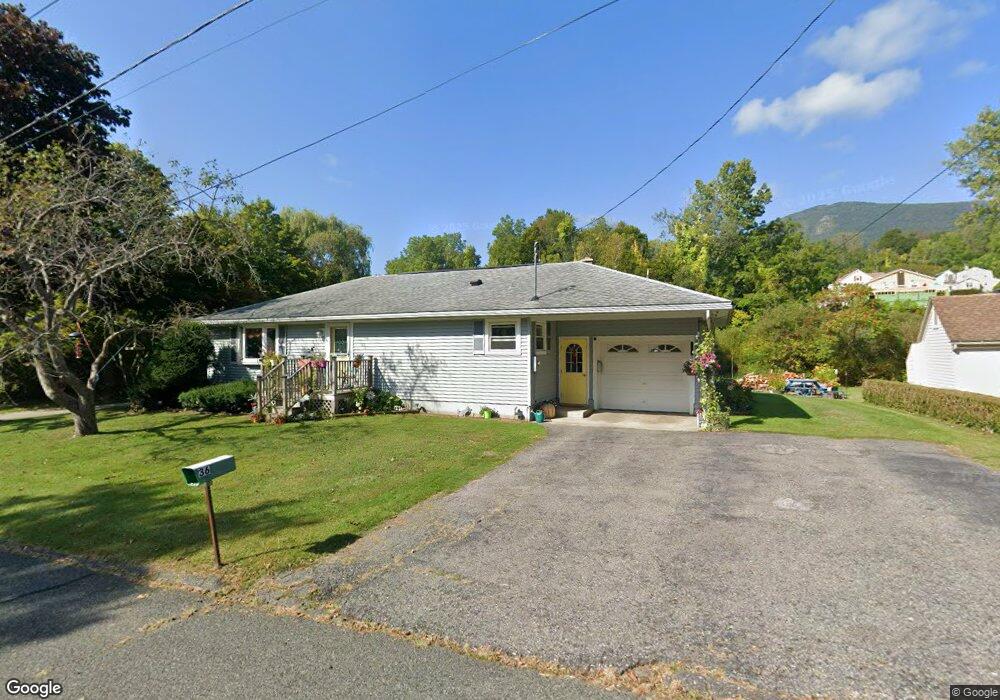
This home is located at 36 Greylock Ave, Adams, MA 01220 and is currently estimated at $283,758, approximately $235 per square foot. 36 Greylock Ave is a home located in Berkshire County with nearby schools including Hoosac Valley Middle & High School, Berkshire Arts & Technology Charter Public School, and St. Stanislaus Kostka School.
Ownership History
Date
Name
Owned For
Owner Type
Purchase Details
Closed on
Sep 9, 1991
Sold by
Fieldler David F and Smith Janice
Bought by
Tatro Jeffrey E
Current Estimated Value
Home Financials for this Owner
Home Financials are based on the most recent Mortgage that was taken out on this home.
Original Mortgage
$81,089
Interest Rate
9.43%
Mortgage Type
Purchase Money Mortgage
Create a Home Valuation Report for This Property
The Home Valuation Report is an in-depth analysis detailing your home's value as well as a comparison with similar homes in the area
Home Values in the Area
Average Home Value in this Area
Purchase History
| Date | Buyer | Sale Price | Title Company |
|---|---|---|---|
| Tatro Jeffrey E | $81,000 | -- |
Source: Public Records
Mortgage History
| Date | Status | Borrower | Loan Amount |
|---|---|---|---|
| Open | Tatro Jeffrey E | $87,900 | |
| Closed | Tatro Jeffrey E | $8,100 | |
| Closed | Tatro Jeffrey E | $79,943 | |
| Closed | Tatro Jeffrey E | $81,089 |
Source: Public Records
Tax History
| Year | Tax Paid | Tax Assessment Tax Assessment Total Assessment is a certain percentage of the fair market value that is determined by local assessors to be the total taxable value of land and additions on the property. | Land | Improvement |
|---|---|---|---|---|
| 2025 | $3,768 | $221,500 | $54,100 | $167,400 |
| 2024 | $3,555 | $202,700 | $50,900 | $151,800 |
| 2023 | $3,302 | $178,000 | $46,300 | $131,700 |
| 2022 | $3,215 | $153,900 | $40,200 | $113,700 |
| 2021 | $4,151 | $139,400 | $40,200 | $99,200 |
| 2020 | $7,678 | $140,100 | $40,400 | $99,700 |
| 2019 | $8,405 | $140,100 | $40,400 | $99,700 |
| 2018 | $3,655 | $138,300 | $40,400 | $97,900 |
| 2017 | $7,433 | $138,300 | $40,400 | $97,900 |
| 2016 | $2,798 | $130,800 | $40,400 | $90,400 |
| 2015 | $2,740 | $128,200 | $42,300 | $85,900 |
| 2014 | $2,558 | $128,200 | $42,300 | $85,900 |
Source: Public Records
Map
Nearby Homes
Your Personal Tour Guide
Ask me questions while you tour the home.