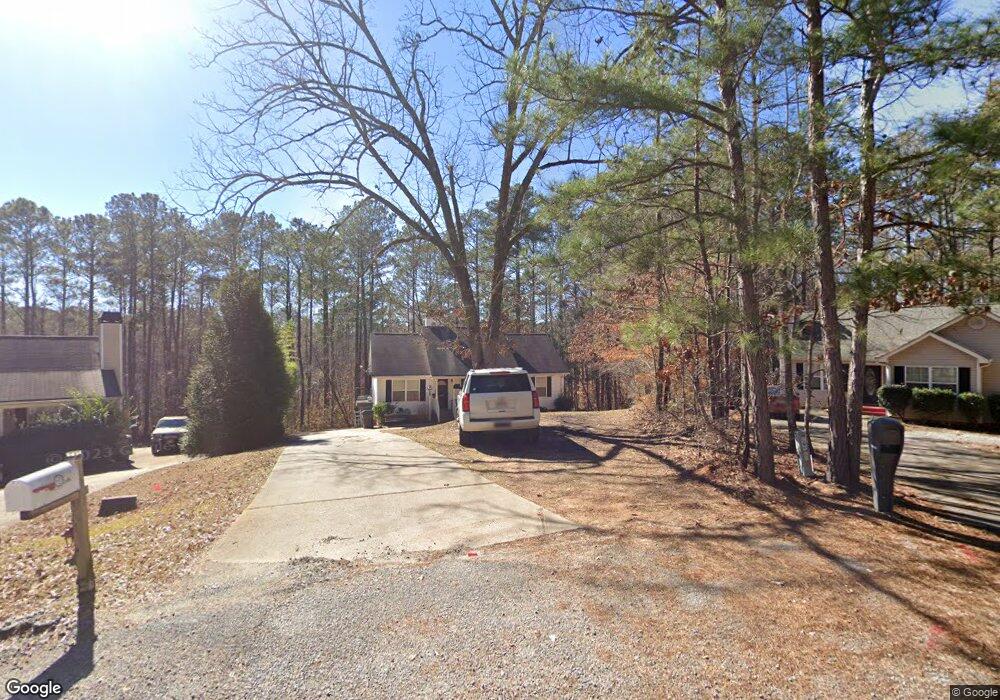
36 Grosbeak Ct Monticello, GA 31064
Jasper County NeighborhoodEstimated Value: $238,027 - $265,000
--
Bed
2
Baths
1,188
Sq Ft
$214/Sq Ft
Est. Value
About This Home
This home is located at 36 Grosbeak Ct, Monticello, GA 31064 and is currently estimated at $254,007, approximately $213 per square foot. 36 Grosbeak Ct is a home located in Jasper County with nearby schools including Jasper County Primary School, Washington Park Elementary School, and Jasper County Middle School.
Ownership History
Date
Name
Owned For
Owner Type
Purchase Details
Closed on
May 4, 2023
Sold by
Hamby Theresa
Bought by
Cleghorn Christy
Current Estimated Value
Purchase Details
Closed on
Feb 15, 2007
Sold by
Federal National Mortgage Association
Bought by
Hamby Teresa
Purchase Details
Closed on
Nov 7, 2006
Sold by
Not Provided
Bought by
Hamby Teresa
Purchase Details
Closed on
Oct 31, 2005
Sold by
Turtle Cove Homebuilders Llc
Bought by
Mcginnis Daniel B
Home Financials for this Owner
Home Financials are based on the most recent Mortgage that was taken out on this home.
Original Mortgage
$96,900
Interest Rate
5.84%
Mortgage Type
New Conventional
Purchase Details
Closed on
Jun 14, 2005
Sold by
Starfirst Homes Inc
Bought by
Turtle Cove Homesbuilders Llc
Purchase Details
Closed on
May 6, 2002
Sold by
Ashley Mitchell and Ashley Anne
Bought by
Starfirst Homes Inc
Create a Home Valuation Report for This Property
The Home Valuation Report is an in-depth analysis detailing your home's value as well as a comparison with similar homes in the area
Home Values in the Area
Average Home Value in this Area
Purchase History
| Date | Buyer | Sale Price | Title Company |
|---|---|---|---|
| Cleghorn Christy | -- | -- | |
| Hamby Teresa | $98,000 | -- | |
| Hamby Teresa | -- | -- | |
| Hamby Teresa | -- | -- | |
| Mcginnis Daniel B | $96,900 | -- | |
| Turtle Cove Homesbuilders Llc | $20,000 | -- | |
| Starfirst Homes Inc | -- | -- |
Source: Public Records
Mortgage History
| Date | Status | Borrower | Loan Amount |
|---|---|---|---|
| Previous Owner | Mcginnis Daniel B | $96,900 |
Source: Public Records
Tax History Compared to Growth
Tax History
| Year | Tax Paid | Tax Assessment Tax Assessment Total Assessment is a certain percentage of the fair market value that is determined by local assessors to be the total taxable value of land and additions on the property. | Land | Improvement |
|---|---|---|---|---|
| 2024 | $2,215 | $79,240 | $3,600 | $75,640 |
| 2023 | $1,801 | $71,000 | $2,600 | $68,400 |
| 2022 | $1,638 | $60,400 | $2,600 | $57,800 |
| 2021 | $1,454 | $49,440 | $1,040 | $48,400 |
| 2020 | $1,404 | $46,160 | $1,040 | $45,120 |
| 2019 | $1,748 | $46,640 | $800 | $45,840 |
| 2018 | $1,346 | $42,400 | $800 | $41,600 |
| 2017 | $1,245 | $38,840 | $800 | $38,040 |
| 2016 | $1,112 | $34,600 | $800 | $33,800 |
| 2015 | $968 | $29,360 | $400 | $28,960 |
| 2014 | $714 | $22,560 | $400 | $22,160 |
Source: Public Records
Map
Nearby Homes
- 389 Waxwing Dr
- 114 Heron Ct
- 15 Egret Ct
- 76 Killdeer Ln
- 281 Mockingbird Dr
- 0 Waxwing Dr Unit 10518396
- 235 Waxwing Dr
- 128 Turtle Cove Trailway
- 128 Turtle Cove
- 45 Pelican Cir
- 111 Turtle Cove Throughway
- 125 Pelican Cir
- 118 Turtle Cove Throughway
- 94 Bunting Ct
- 240 Pelican Cir
- 238 W Mourning Dove
- 124 Flamingo Dr
- 55 Swan Ct
- 1144 Turtle Cove Throughway
- 243 Pelican Cir
- 40 Grosbeak Ct
- 33 Grosbeak Ct Unit 84
- 33 Grosbeak Ct
- 0 Grosbeak Ct Unit 8587856
- 0 Grosbeak Ct Unit 8771281
- 21 Grosbeak Ct
- 1 Grosbeak Ct
- 540 Waxwing Dr
- 480 Waxwing Dr Unit 159
- 480 Waxwing Dr
- 523 Turtle Cove Throughway
- 566 Waxwing Dr
- 573 Waxwing Dr
- 0 Egret Ct Unit 37 3097969
- 0 Egret Ct Unit 40 7448309
- 0 Egret Ct Unit LOT 40 20170812
- 0 Egret Ct Unit 7147275
- 0 Egret Ct Unit 10112222
- 0 Egret Ct Unit LOT 41 20056214
- 0 Egret Ct Unit 20040341