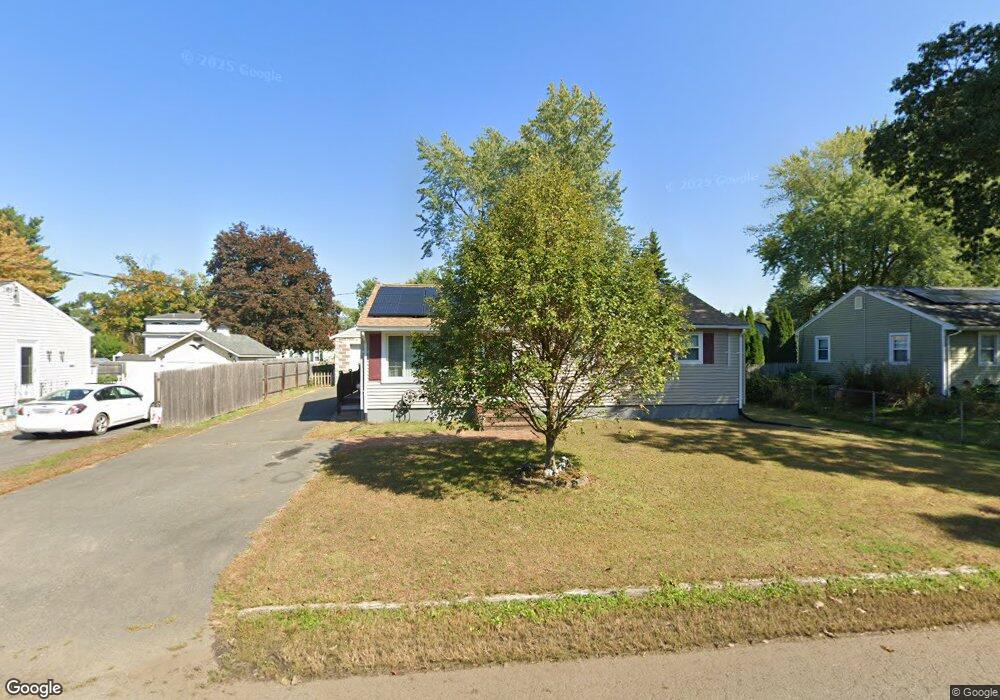
36 Hall St Feeding Hills, MA 01030
Estimated Value: $273,000 - $327,000
3
Beds
1
Bath
960
Sq Ft
$311/Sq Ft
Est. Value
About This Home
This home is located at 36 Hall St, Feeding Hills, MA 01030 and is currently estimated at $298,943, approximately $311 per square foot. 36 Hall St is a home located in Hampden County with nearby schools including Agawam Junior High School, Agawam High School, and St Thomas The Apostle School.
Ownership History
Date
Name
Owned For
Owner Type
Purchase Details
Closed on
May 27, 2005
Sold by
Sansoucy Robert J and Sansoucy Marcia L
Bought by
Bordeau Randy and Bordeau Diane J
Current Estimated Value
Home Financials for this Owner
Home Financials are based on the most recent Mortgage that was taken out on this home.
Original Mortgage
$133,000
Outstanding Balance
$70,237
Interest Rate
5.94%
Mortgage Type
Purchase Money Mortgage
Estimated Equity
$228,706
Purchase Details
Closed on
Jul 30, 1999
Sold by
Ricco James A and Ricco Deborah L
Bought by
Sansoucy Robert J and Sancoucy Marcia
Home Financials for this Owner
Home Financials are based on the most recent Mortgage that was taken out on this home.
Original Mortgage
$94,400
Interest Rate
7.61%
Mortgage Type
Purchase Money Mortgage
Purchase Details
Closed on
Jun 26, 1992
Sold by
Lapine Ethel G and Young David W
Bought by
Ricco James A and Ricco Deborah L
Create a Home Valuation Report for This Property
The Home Valuation Report is an in-depth analysis detailing your home's value as well as a comparison with similar homes in the area
Home Values in the Area
Average Home Value in this Area
Purchase History
| Date | Buyer | Sale Price | Title Company |
|---|---|---|---|
| Bordeau Randy | $180,000 | -- | |
| Sansoucy Robert J | $118,000 | -- | |
| Ricco James A | $90,000 | -- |
Source: Public Records
Mortgage History
| Date | Status | Borrower | Loan Amount |
|---|---|---|---|
| Open | Bordeau Randy | $133,000 | |
| Previous Owner | Ricco James A | $23,000 | |
| Previous Owner | Ricco James A | $94,400 | |
| Previous Owner | Ricco James A | $94,400 |
Source: Public Records
Tax History Compared to Growth
Tax History
| Year | Tax Paid | Tax Assessment Tax Assessment Total Assessment is a certain percentage of the fair market value that is determined by local assessors to be the total taxable value of land and additions on the property. | Land | Improvement |
|---|---|---|---|---|
| 2025 | $4,152 | $283,600 | $96,200 | $187,400 |
| 2024 | $4,042 | $278,000 | $96,200 | $181,800 |
| 2023 | $3,874 | $245,500 | $83,300 | $162,200 |
| 2022 | $3,741 | $232,200 | $83,300 | $148,900 |
| 2021 | $3,572 | $212,600 | $77,400 | $135,200 |
| 2020 | $3,497 | $207,800 | $76,300 | $131,500 |
| 2019 | $3,400 | $204,200 | $74,700 | $129,500 |
| 2018 | $3,236 | $194,800 | $74,700 | $120,100 |
| 2017 | $3,078 | $188,700 | $74,700 | $114,000 |
| 2016 | $3,016 | $186,400 | $74,700 | $111,700 |
| 2015 | $2,860 | $181,700 | $74,700 | $107,000 |
Source: Public Records
Map
Nearby Homes
- lot A North St
- 94 Witheridge St
- 56 Taft St
- 92 Highland St
- 712 Cooper St
- 10 Nolan Ln
- 335-337 Springfield St
- 25 Damato Way
- 14 Granger Dr
- 157 Cambridge St
- 42 Lakeview Cir
- 14 Greenacre Ln
- 354 Rowley St
- 6 Mansion Woods Dr Unit A
- 60 Elizabeth St
- 11 Stanley Place
- 138 Suffield St
- 73 Silver Lake Dr
- 36-38 Orlando St
- 25 Hillcrest St