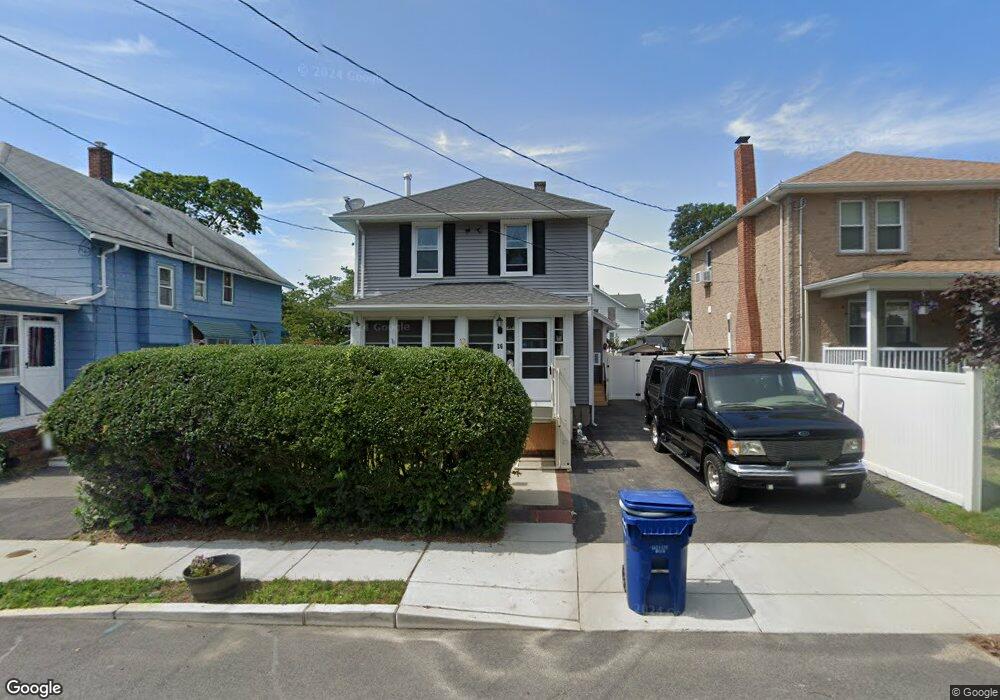
36 Hedge St Fairhaven, MA 02719
Oxford NeighborhoodEstimated Value: $438,910 - $473,000
3
Beds
1
Bath
1,256
Sq Ft
$361/Sq Ft
Est. Value
About This Home
This home is located at 36 Hedge St, Fairhaven, MA 02719 and is currently estimated at $453,228, approximately $360 per square foot. 36 Hedge St is a home located in Bristol County with nearby schools including Fairhaven High School, Alma Del Mar Charter School, and City On A Hill Charter Public School New Bedford.
Ownership History
Date
Name
Owned For
Owner Type
Purchase Details
Closed on
Jul 3, 2006
Sold by
Powers Denise L
Bought by
Denison Dennis M and Denison Jane E
Current Estimated Value
Home Financials for this Owner
Home Financials are based on the most recent Mortgage that was taken out on this home.
Original Mortgage
$203,920
Interest Rate
6.58%
Mortgage Type
Purchase Money Mortgage
Purchase Details
Closed on
Oct 31, 2001
Sold by
Nicholson Hildur E
Bought by
Powers Denise L
Create a Home Valuation Report for This Property
The Home Valuation Report is an in-depth analysis detailing your home's value as well as a comparison with similar homes in the area
Home Values in the Area
Average Home Value in this Area
Purchase History
| Date | Buyer | Sale Price | Title Company |
|---|---|---|---|
| Denison Dennis M | $254,900 | -- | |
| Powers Denise L | $127,900 | -- |
Source: Public Records
Mortgage History
| Date | Status | Borrower | Loan Amount |
|---|---|---|---|
| Open | Powers Denise L | $256,750 | |
| Closed | Powers Denise L | $203,920 |
Source: Public Records
Tax History
| Year | Tax Paid | Tax Assessment Tax Assessment Total Assessment is a certain percentage of the fair market value that is determined by local assessors to be the total taxable value of land and additions on the property. | Land | Improvement |
|---|---|---|---|---|
| 2025 | $32 | $341,300 | $169,200 | $172,100 |
| 2024 | $3,069 | $332,500 | $169,200 | $163,300 |
| 2023 | $2,985 | $300,000 | $148,200 | $151,800 |
| 2022 | $2,894 | $283,200 | $137,700 | $145,500 |
| 2021 | $2,758 | $244,300 | $124,600 | $119,700 |
| 2020 | $2,702 | $244,300 | $124,600 | $119,700 |
| 2019 | $5,867 | $213,600 | $103,400 | $110,200 |
| 2018 | $4,589 | $203,600 | $98,400 | $105,200 |
| 2017 | $3,103 | $196,500 | $98,400 | $98,100 |
| 2016 | $2,291 | $188,100 | $98,400 | $89,700 |
| 2015 | $2,267 | $186,600 | $98,400 | $88,200 |
Source: Public Records
Map
Nearby Homes
Your Personal Tour Guide
Ask me questions while you tour the home.