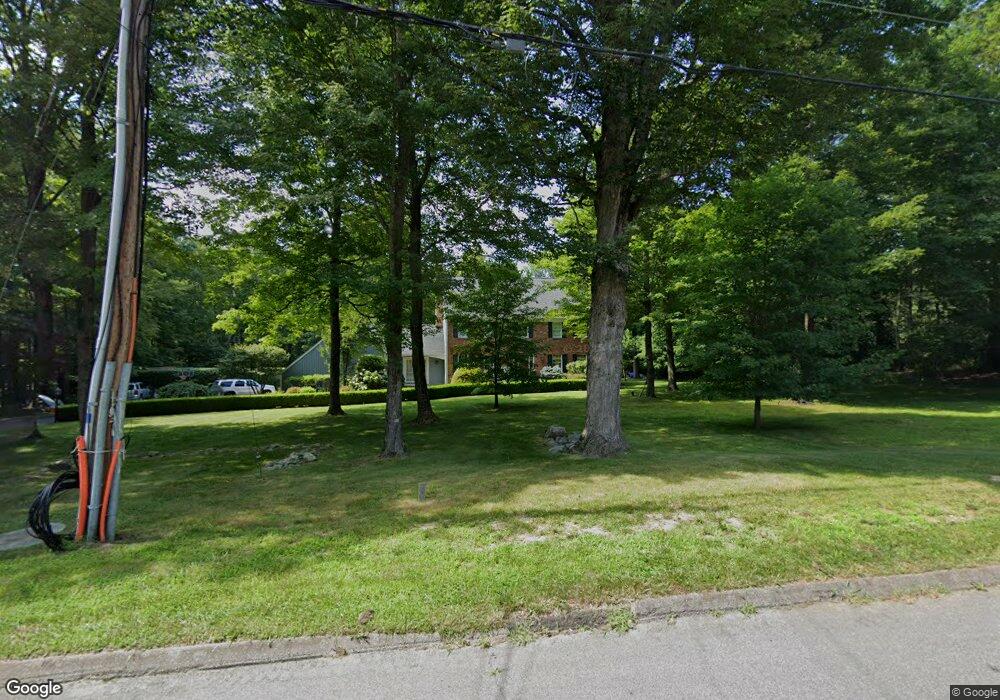
36 High Ridge Rd Redding, CT 06896
Estimated Value: $1,053,000 - $1,160,000
4
Beds
3
Baths
3,203
Sq Ft
$342/Sq Ft
Est. Value
About This Home
This home is located at 36 High Ridge Rd, Redding, CT 06896 and is currently estimated at $1,094,816, approximately $341 per square foot. 36 High Ridge Rd is a home located in Fairfield County with nearby schools including Redding Elementary School, John Read Middle School, and Joel Barlow High School.
Ownership History
Date
Name
Owned For
Owner Type
Purchase Details
Closed on
Aug 22, 2017
Sold by
Cervi Michael A and Cervi Kate D
Bought by
Kady Nicholas A and Kady Colleen K
Current Estimated Value
Home Financials for this Owner
Home Financials are based on the most recent Mortgage that was taken out on this home.
Original Mortgage
$315,000
Outstanding Balance
$262,843
Interest Rate
3.96%
Mortgage Type
Purchase Money Mortgage
Estimated Equity
$831,973
Purchase Details
Closed on
May 24, 2010
Sold by
Valeri Paul J and Valeri Denise L
Bought by
Cervi Michael A and Cervi Kate D
Purchase Details
Closed on
Jun 27, 2003
Sold by
Woolfolk Marc and Woolfolk Claire
Bought by
Valeri Paul and Valeri Denise
Purchase Details
Closed on
Jan 9, 1998
Sold by
Paradise Kevin J and Paradise Alison M
Bought by
Woolfolk Marc E and Woolfolk Claire M
Purchase Details
Closed on
Dec 3, 1990
Sold by
Smalley Arthur C
Bought by
Paradise Kevin J
Create a Home Valuation Report for This Property
The Home Valuation Report is an in-depth analysis detailing your home's value as well as a comparison with similar homes in the area
Home Values in the Area
Average Home Value in this Area
Purchase History
| Date | Buyer | Sale Price | Title Company |
|---|---|---|---|
| Kady Nicholas A | $690,000 | -- | |
| Cervi Michael A | $710,000 | -- | |
| Valeri Paul | $600,000 | -- | |
| Woolfolk Marc E | $450,000 | -- | |
| Paradise Kevin J | $380,000 | -- |
Source: Public Records
Mortgage History
| Date | Status | Borrower | Loan Amount |
|---|---|---|---|
| Open | Paradise Kevin J | $68,500 | |
| Open | Paradise Kevin J | $315,000 |
Source: Public Records
Tax History
| Year | Tax Paid | Tax Assessment Tax Assessment Total Assessment is a certain percentage of the fair market value that is determined by local assessors to be the total taxable value of land and additions on the property. | Land | Improvement |
|---|---|---|---|---|
| 2025 | $15,609 | $528,400 | $154,200 | $374,200 |
| 2024 | $15,176 | $528,400 | $154,200 | $374,200 |
| 2023 | $14,631 | $528,400 | $154,200 | $374,200 |
| 2022 | $14,766 | $442,900 | $166,500 | $276,400 |
| 2021 | $14,545 | $442,900 | $166,500 | $276,400 |
| 2020 | $14,545 | $442,900 | $166,500 | $276,400 |
| 2019 | $14,545 | $442,900 | $166,500 | $276,400 |
| 2018 | $19,050 | $442,900 | $166,500 | $276,400 |
| 2017 | $19,305 | $477,700 | $182,200 | $295,500 |
| 2016 | $13,942 | $476,800 | $182,200 | $294,600 |
| 2015 | $13,784 | $476,800 | $182,200 | $294,600 |
| 2014 | $13,784 | $476,800 | $182,200 | $294,600 |
Source: Public Records
Map
Nearby Homes
- 241 Black Rock Turnpike
- 41 Sullivan Dr
- 7 Long Meadow Ln
- 2 Longwood Dr
- 41 Deer Hill Rd
- 63 Turney Rd
- 45 Great Pasture Rd
- 138 Putnam Park Rd
- 193 Chestnut Ridge Rd
- 24 Costa Ln
- lot5B Nicolina Way
- 9 Nicolina Way
- 18 Sebastian Tr
- 6 Vona Way
- 9A Oak Ridge Dr
- 31 Oak Ridge Dr
- 173 Chestnut Ridge Rd
- 36 Fox Run Rd
- 294 Maple Rd
- 41 Ridge Line Rd
- 34 High Ridge Rd
- 38 High Ridge Rd
- 35 High Ridge Rd
- 52 High Ridge Rd
- 44 High Ridge Rd
- 54 High Ridge Rd
- 32 High Ridge Rd
- 47 High Ridge Rd
- 39 High Ridge Rd
- 3 Little River Ln
- 33 High Ridge Rd
- 41 High Ridge Rd
- 37 High Ridge Rd
- 53 High Ridge Rd
- 51 High Ridge Rd
- 30 High Ridge Rd
- 5 Little River Ln
- 55 High Ridge Rd
- 2 Little River Ln
- 6 Little River Ln
Your Personal Tour Guide
Ask me questions while you tour the home.