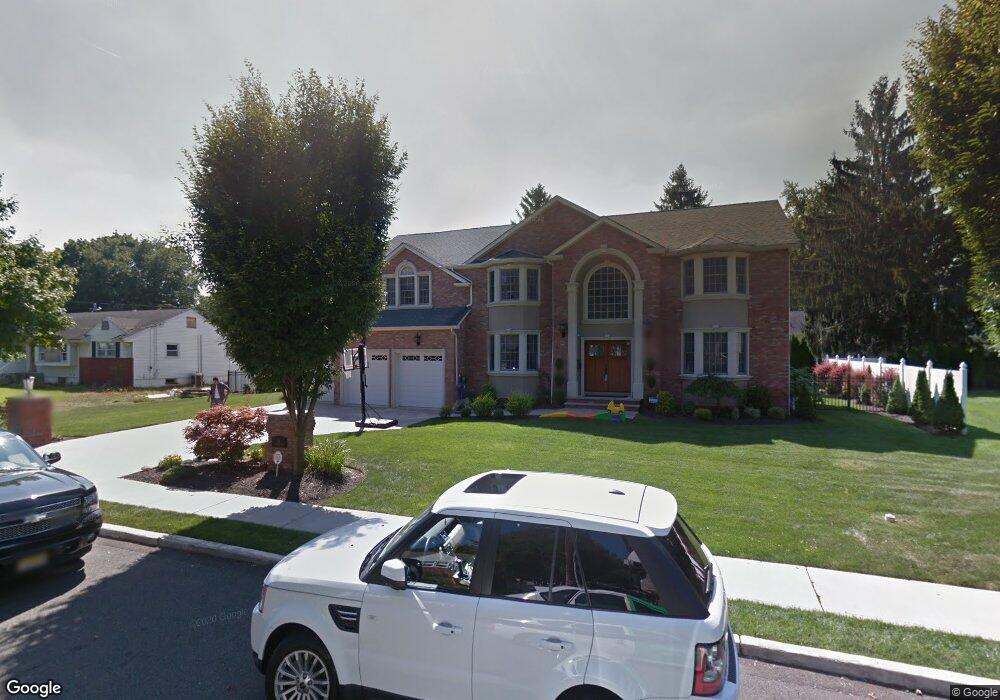
36 Hollybrook Rd Paramus, NJ 07652
Estimated Value: $1,839,422 - $2,042,000
6
Beds
5
Baths
4,204
Sq Ft
$458/Sq Ft
Est. Value
About This Home
This home is located at 36 Hollybrook Rd, Paramus, NJ 07652 and is currently estimated at $1,926,106, approximately $458 per square foot. 36 Hollybrook Rd is a home located in Bergen County with nearby schools including Paramus High School and Alpine Learning Group.
Ownership History
Date
Name
Owned For
Owner Type
Purchase Details
Closed on
Aug 29, 2007
Sold by
Oxford Custom Home Builders Llc
Bought by
Sarkar James and Sarkar Nellina
Current Estimated Value
Home Financials for this Owner
Home Financials are based on the most recent Mortgage that was taken out on this home.
Original Mortgage
$750,000
Outstanding Balance
$478,245
Interest Rate
6.71%
Mortgage Type
New Conventional
Estimated Equity
$1,447,861
Purchase Details
Closed on
Aug 7, 2007
Sold by
Oxford Custom Home Builders Llc
Bought by
Sarkar James and Sarkar Nellina
Home Financials for this Owner
Home Financials are based on the most recent Mortgage that was taken out on this home.
Original Mortgage
$750,000
Outstanding Balance
$478,245
Interest Rate
6.71%
Mortgage Type
New Conventional
Estimated Equity
$1,447,861
Purchase Details
Closed on
Sep 26, 2006
Sold by
Northpine Development Co
Bought by
Oxford Custom Home Builders Ll
Purchase Details
Closed on
Jan 11, 2005
Sold by
Feldman Helen
Bought by
Northpine Development Co
Create a Home Valuation Report for This Property
The Home Valuation Report is an in-depth analysis detailing your home's value as well as a comparison with similar homes in the area
Home Values in the Area
Average Home Value in this Area
Purchase History
| Date | Buyer | Sale Price | Title Company |
|---|---|---|---|
| Sarkar James | $1,200,000 | -- | |
| Sarkar James | $1,200,000 | -- | |
| Oxford Custom Home Builders Ll | $540,000 | -- | |
| Northpine Development Co | $570,000 | -- |
Source: Public Records
Mortgage History
| Date | Status | Borrower | Loan Amount |
|---|---|---|---|
| Open | Sarkar James | $750,000 | |
| Closed | Sarkar James | $750,000 |
Source: Public Records
Tax History
| Year | Tax Paid | Tax Assessment Tax Assessment Total Assessment is a certain percentage of the fair market value that is determined by local assessors to be the total taxable value of land and additions on the property. | Land | Improvement |
|---|---|---|---|---|
| 2025 | $21,611 | $1,511,200 | $445,300 | $1,065,900 |
| 2024 | $21,074 | $1,427,400 | $412,100 | $1,015,300 |
| 2023 | $20,022 | $1,373,800 | $394,200 | $979,600 |
| 2022 | $20,022 | $1,290,100 | $367,500 | $922,600 |
| 2021 | $19,620 | $1,186,200 | $336,800 | $849,400 |
| 2020 | $18,663 | $1,170,100 | $331,800 | $838,300 |
| 2019 | $21,929 | $1,181,500 | $313,900 | $867,600 |
| 2018 | $21,657 | $1,181,500 | $313,900 | $867,600 |
| 2017 | $21,279 | $1,181,500 | $313,900 | $867,600 |
| 2016 | $20,700 | $1,181,500 | $313,900 | $867,600 |
| 2015 | $20,487 | $1,181,500 | $313,900 | $867,600 |
| 2014 | $20,310 | $1,181,500 | $313,900 | $867,600 |
Source: Public Records
Map
Nearby Homes
- 18 Vermont Dr
- 704 Evans St
- 648 Falmouth Ave
- 86 Azalea St
- 82 Azalea St
- 801 Godwin Rd
- 643 Spring Ave
- 780 Hilton Place
- 1153 Linwood Ave
- 303 Pershing Ave
- 65 Edgewood Dr
- 602 Mill Run
- 778 E Ridgewood Ave
- 615 Shelton Rd
- 743 Boyd Rd
- 163 Hampton Place
- 364 Westfield Ave
- 304 Blauvelt Ct
- 232 W Midland Ave
- 415 Linwood Ave
Your Personal Tour Guide
Ask me questions while you tour the home.