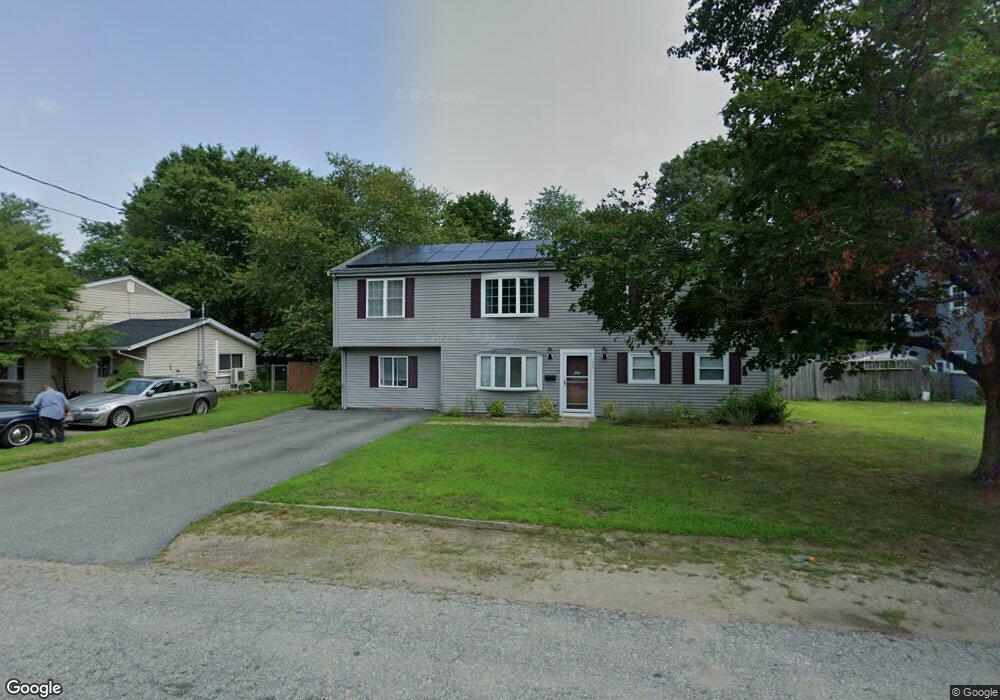
36 Ida Ave Brockton, MA 02302
Estimated Value: $628,331 - $757,000
7
Beds
3
Baths
3,036
Sq Ft
$224/Sq Ft
Est. Value
About This Home
This home is located at 36 Ida Ave, Brockton, MA 02302 and is currently estimated at $680,833, approximately $224 per square foot. 36 Ida Ave is a home located in Plymouth County with nearby schools including Brookfield Elementary School, Downey Elementary School, and Ashfield Middle School.
Ownership History
Date
Name
Owned For
Owner Type
Purchase Details
Closed on
Dec 12, 2016
Sold by
Bamforth William and Bamforth Keri
Bought by
Bamforth Keri
Current Estimated Value
Purchase Details
Closed on
Mar 5, 1999
Sold by
Hoban Marsilia
Bought by
Leonard Keri
Purchase Details
Closed on
Feb 4, 1999
Sold by
Assocaties Home Equity
Bought by
Hoban Marsilia
Purchase Details
Closed on
Sep 9, 1998
Sold by
Carlino James A and Associates Home Equity
Bought by
Associates Home Equity
Purchase Details
Closed on
Aug 12, 1996
Sold by
Amundarain Kimberly A
Bought by
Carlino James A and Carlino Mary P
Purchase Details
Closed on
Aug 5, 1993
Sold by
Walsh Richard A and Walsh Suzanne
Bought by
Amudarain Kimberly A
Purchase Details
Closed on
Dec 8, 1989
Sold by
Dunning Russell K
Bought by
Walsh Richard A
Purchase Details
Closed on
Mar 27, 1987
Sold by
Corndell Stephen R
Bought by
Dunning Russell K
Create a Home Valuation Report for This Property
The Home Valuation Report is an in-depth analysis detailing your home's value as well as a comparison with similar homes in the area
Home Values in the Area
Average Home Value in this Area
Purchase History
| Date | Buyer | Sale Price | Title Company |
|---|---|---|---|
| Bamforth Keri | -- | -- | |
| Leonard Keri | $89,900 | -- | |
| Hoban Marsilia | $65,000 | -- | |
| Associates Home Equity | $77,350 | -- | |
| Carlino James A | $79,000 | -- | |
| Amudarain Kimberly A | $79,000 | -- | |
| Walsh Richard A | $109,000 | -- | |
| Dunning Russell K | $112,500 | -- |
Source: Public Records
Mortgage History
| Date | Status | Borrower | Loan Amount |
|---|---|---|---|
| Previous Owner | Dunning Russell K | $30,000 | |
| Previous Owner | Dunning Russell K | $115,000 |
Source: Public Records
Tax History Compared to Growth
Tax History
| Year | Tax Paid | Tax Assessment Tax Assessment Total Assessment is a certain percentage of the fair market value that is determined by local assessors to be the total taxable value of land and additions on the property. | Land | Improvement |
|---|---|---|---|---|
| 2025 | $6,314 | $521,400 | $144,900 | $376,500 |
| 2024 | $5,993 | $498,600 | $144,900 | $353,700 |
| 2023 | $5,518 | $425,100 | $109,800 | $315,300 |
| 2022 | $5,508 | $394,300 | $99,800 | $294,500 |
| 2021 | $5,250 | $362,100 | $94,400 | $267,700 |
| 2020 | $6,278 | $414,400 | $90,500 | $323,900 |
| 2019 | $5,692 | $366,300 | $84,800 | $281,500 |
| 2018 | $5,044 | $314,100 | $84,800 | $229,300 |
| 2017 | $5,068 | $314,800 | $84,800 | $230,000 |
| 2016 | $4,498 | $259,100 | $80,900 | $178,200 |
| 2015 | $4,659 | $256,700 | $80,900 | $175,800 |
| 2014 | $4,503 | $248,400 | $80,900 | $167,500 |
Source: Public Records
Map
Nearby Homes