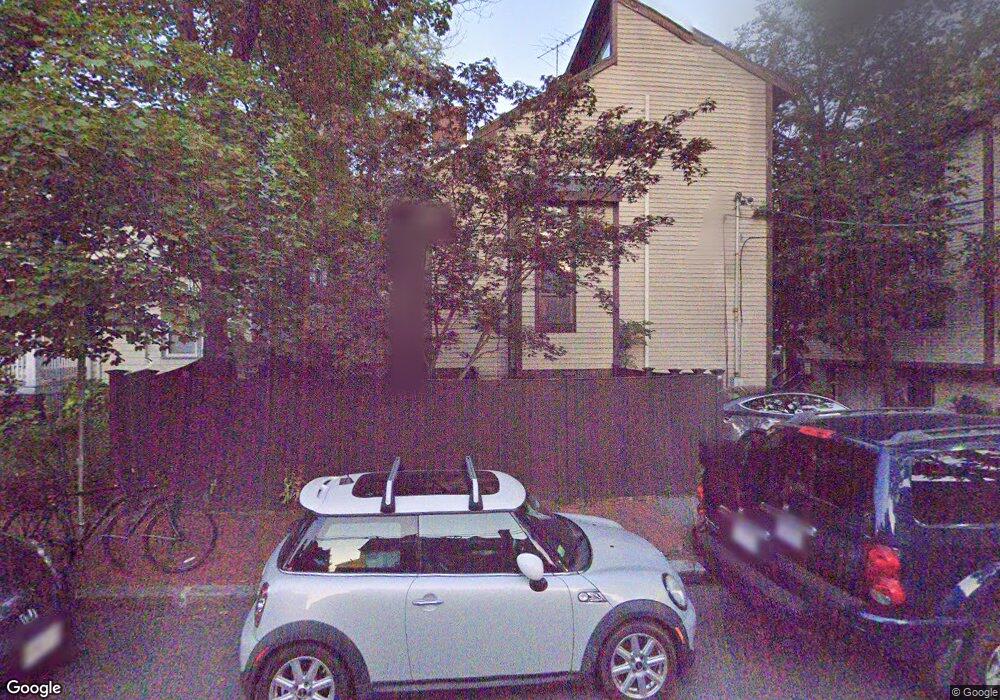
36 Irving St Unit D Cambridge, MA 02138
Mid-Cambridge NeighborhoodEstimated Value: $1,542,186 - $1,632,000
2
Beds
3
Baths
1,174
Sq Ft
$1,357/Sq Ft
Est. Value
About This Home
This home is located at 36 Irving St Unit D, Cambridge, MA 02138 and is currently estimated at $1,593,297, approximately $1,357 per square foot. 36 Irving St Unit D is a home located in Middlesex County with nearby schools including Saint Paul's Choir School.
Ownership History
Date
Name
Owned For
Owner Type
Purchase Details
Closed on
Nov 8, 2023
Sold by
Roberts J S
Bought by
Stewart Roberts T J and Stewart Roberts
Current Estimated Value
Purchase Details
Closed on
Sep 14, 2007
Sold by
Hanan Anneliese and Hanan Patrick D
Bought by
Atwood Nancy C
Purchase Details
Closed on
Feb 9, 2005
Sold by
Hanan Anneliese
Bought by
Hanan Anneliese and Hanan Patrick D
Purchase Details
Closed on
Oct 27, 1995
Sold by
Daniels William L and Daniels Margaret G
Bought by
Wager Jeffrey D
Purchase Details
Closed on
Apr 27, 1995
Sold by
Gampel Dorothy H
Bought by
Warburton David J and Gau Betty J
Purchase Details
Closed on
Feb 4, 1991
Sold by
Debral Rlty Inc
Bought by
Darling Charles
Purchase Details
Closed on
Dec 21, 1990
Sold by
Bell Douglas E
Bought by
Debral Rlty Inc
Purchase Details
Closed on
Mar 15, 1988
Sold by
Kranz Erich S
Bought by
Hanan Patrick D
Create a Home Valuation Report for This Property
The Home Valuation Report is an in-depth analysis detailing your home's value as well as a comparison with similar homes in the area
Home Values in the Area
Average Home Value in this Area
Purchase History
| Date | Buyer | Sale Price | Title Company |
|---|---|---|---|
| Stewart Roberts T J | -- | None Available | |
| Atwood Nancy C | $601,050 | -- | |
| Atwood Nancy C | $601,050 | -- | |
| Hanan Anneliese | -- | -- | |
| Wager Jeffrey D | $240,000 | -- | |
| Warburton David J | $250,000 | -- | |
| Darling Charles | $285,000 | -- | |
| Debral Rlty Inc | $180,000 | -- | |
| Hanan Patrick D | $240,000 | -- |
Source: Public Records
Mortgage History
| Date | Status | Borrower | Loan Amount |
|---|---|---|---|
| Previous Owner | Hanan Patrick D | $415,000 |
Source: Public Records
Tax History Compared to Growth
Tax History
| Year | Tax Paid | Tax Assessment Tax Assessment Total Assessment is a certain percentage of the fair market value that is determined by local assessors to be the total taxable value of land and additions on the property. | Land | Improvement |
|---|---|---|---|---|
| 2025 | $8,554 | $1,347,100 | $852,900 | $494,200 |
| 2024 | $8,323 | $1,405,900 | $932,900 | $473,000 |
| 2023 | $7,826 | $1,335,500 | $927,300 | $408,200 |
| 2022 | $7,926 | $1,338,900 | $978,100 | $360,800 |
| 2021 | $7,443 | $1,272,300 | $938,900 | $333,400 |
| 2020 | $6,995 | $1,216,600 | $900,400 | $316,200 |
| 2019 | $6,284 | $1,057,900 | $766,100 | $291,800 |
| 2018 | $5,769 | $917,200 | $691,400 | $225,800 |
| 2017 | $5,676 | $874,500 | $659,100 | $215,400 |
| 2016 | $5,431 | $776,900 | $549,700 | $227,200 |
| 2015 | $5,287 | $676,100 | $472,600 | $203,500 |
| 2014 | $5,257 | $627,300 | $435,300 | $192,000 |
Source: Public Records
Map
Nearby Homes
- 104 Trowbridge St Unit 3
- 114 Trowbridge St Unit 2
- 15 Roberts Rd Unit D
- 13 Roberts Rd
- 1657 Cambridge St
- 1699 Cambridge St Unit 50
- 89 Kirkland St Unit 89
- 106 Ellery St
- 33 Line St Unit 1
- 97 Beacon St
- 60 Ellery St
- 2 Ellery Square
- 55 Ellery St Unit 3
- 54 Ellery St Unit 3
- 5 Waldo Ave Unit 2A
- 17 Marie Ave Unit 3
- 55 Museum St
- 55 Museum St Unit 55
- 47 Dane St
- 43 Park St Unit 18
- 36 Irving St Unit 3
- 36 Irving St Unit 2
- 36 Irving St Unit H
- 36 Irving St Unit G
- 36 Irving St Unit F
- 36 Irving St
- 36 Irving St Unit R
- 36 Irving St Unit C
- 36 Irving St Unit B
- 36 Irving St Unit A
- 36 Irving St Unit 8
- 36 Irving St Unit 4
- 36 Irving St Unit 36-1
- 36 Irving St Unit 6
- 36 Irving St
- 36 Irving St Unit 5
- 36 Irving St Unit 7
- 36 Irving St Unit 9
- 99 Trowbridge St Unit 2
- 99 Trowbridge St Unit 1