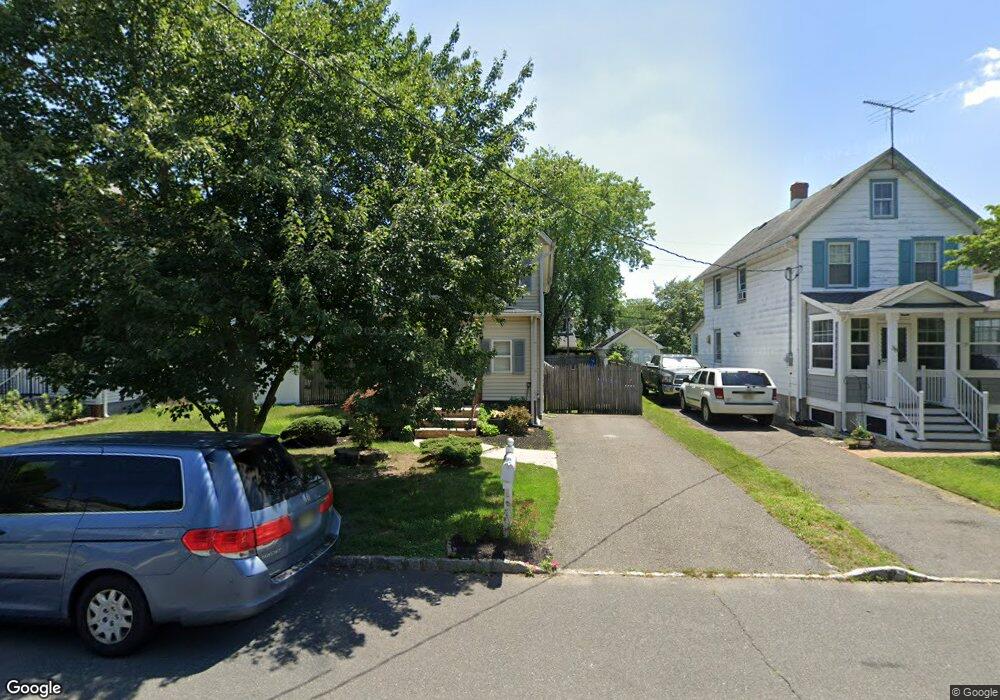
36 John St Helmetta, NJ 08828
Estimated Value: $328,000 - $413,290
3
Beds
2
Baths
1,274
Sq Ft
$307/Sq Ft
Est. Value
About This Home
This home is located at 36 John St, Helmetta, NJ 08828 and is currently estimated at $390,573, approximately $306 per square foot. 36 John St is a home located in Middlesex County with nearby schools including G. Austin Schoenly Elementary School, E. Raymond Appleby Elementary School, and Spotswood Memorial School.
Ownership History
Date
Name
Owned For
Owner Type
Purchase Details
Closed on
Jun 3, 2019
Sold by
Fannie Mae
Bought by
Advantics Solutions Llc
Current Estimated Value
Purchase Details
Closed on
Aug 30, 2017
Sold by
Mooney Joseph and Mooney Joann Alteria
Bought by
Wells Fargo Bank Na
Purchase Details
Closed on
Oct 11, 2005
Sold by
Dzergoski Chris
Bought by
Mooney Joseph and Mooney Joann Alteria
Home Financials for this Owner
Home Financials are based on the most recent Mortgage that was taken out on this home.
Original Mortgage
$256,000
Interest Rate
5.85%
Purchase Details
Closed on
Jun 30, 2000
Sold by
Segrave Christopher
Bought by
Dzergoski Chris and Dzergoski Constance
Home Financials for this Owner
Home Financials are based on the most recent Mortgage that was taken out on this home.
Original Mortgage
$115,000
Interest Rate
8.1%
Create a Home Valuation Report for This Property
The Home Valuation Report is an in-depth analysis detailing your home's value as well as a comparison with similar homes in the area
Home Values in the Area
Average Home Value in this Area
Purchase History
| Date | Buyer | Sale Price | Title Company |
|---|---|---|---|
| Advantics Solutions Llc | $162,000 | Tri County Title Svcs Llc | |
| Wells Fargo Bank Na | -- | None Available | |
| Mooney Joseph | $269,500 | -- | |
| Dzergoski Chris | $150,000 | -- |
Source: Public Records
Mortgage History
| Date | Status | Borrower | Loan Amount |
|---|---|---|---|
| Previous Owner | Mooney Joseph | $256,000 | |
| Previous Owner | Dzergoski Chris | $115,000 |
Source: Public Records
Tax History
| Year | Tax Paid | Tax Assessment Tax Assessment Total Assessment is a certain percentage of the fair market value that is determined by local assessors to be the total taxable value of land and additions on the property. | Land | Improvement |
|---|---|---|---|---|
| 2025 | $6,629 | $195,600 | $93,000 | $102,600 |
| 2024 | $6,380 | $195,600 | $93,000 | $102,600 |
| 2023 | $6,380 | $195,600 | $93,000 | $102,600 |
| 2022 | $6,324 | $195,600 | $93,000 | $102,600 |
| 2021 | $6,172 | $195,600 | $93,000 | $102,600 |
| 2020 | $5,989 | $195,600 | $93,000 | $102,600 |
| 2019 | $6,042 | $195,600 | $93,000 | $102,600 |
| 2018 | $5,964 | $195,600 | $93,000 | $102,600 |
| 2017 | $5,854 | $195,600 | $93,000 | $102,600 |
| 2016 | $5,622 | $195,600 | $93,000 | $102,600 |
| 2015 | $5,369 | $195,600 | $93,000 | $102,600 |
| 2014 | $5,307 | $195,600 | $93,000 | $102,600 |
Source: Public Records
Map
Nearby Homes
- 24 John St
- 92 Main St
- 9 Redwood Ct
- 148 Helmetta Rd
- 2 Butternut Ln
- 6 Holly Manor Ct
- 47 Thomas St
- 15 Sutton Place
- 7 Lake Ave
- 312 Raintree Ct
- 176 Old Forge Rd
- 20 Borghaus Rd
- 18 Avenue B
- 40 Avenue I
- 2710 Ridgefield Ct Unit 2710
- 1007 Meadow Ct
- 38 Avenue I
- 1305 Stoneridge Cir
- 1306 Stoneridge Cir
- 2308 Candlelight Ct Unit 2308
Your Personal Tour Guide
Ask me questions while you tour the home.