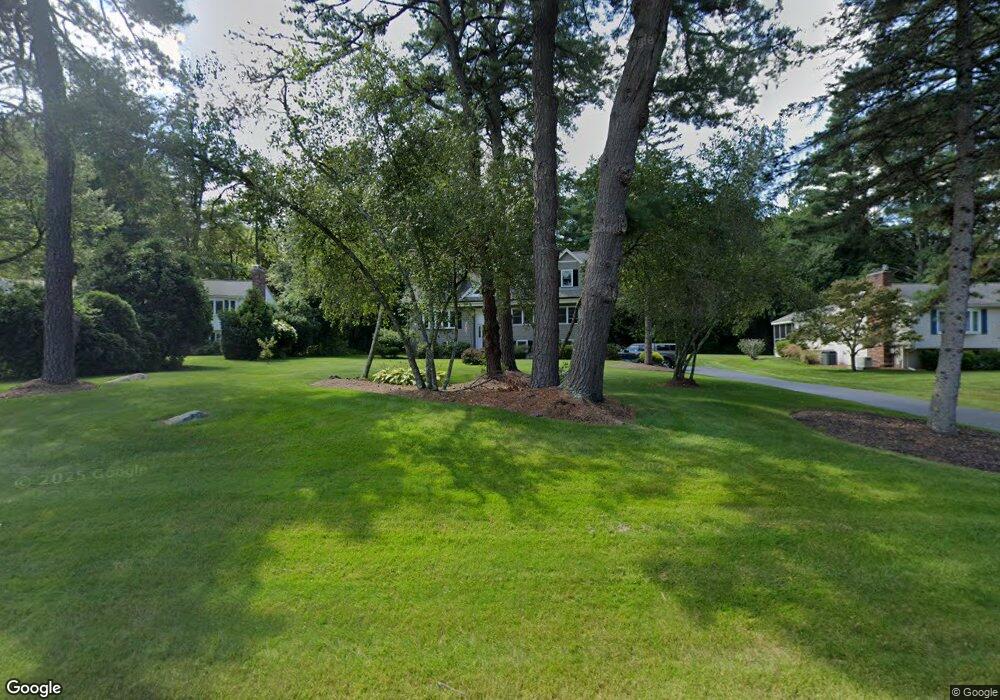
36 Juniper Brook Rd Northborough, MA 01532
Estimated Value: $809,000 - $947,000
3
Beds
2
Baths
1,248
Sq Ft
$710/Sq Ft
Est. Value
About This Home
This home is located at 36 Juniper Brook Rd, Northborough, MA 01532 and is currently estimated at $885,649, approximately $709 per square foot. 36 Juniper Brook Rd is a home located in Worcester County with nearby schools including Marguerite E. Peaslee Elementary School, Robert E. Melican Middle School, and Algonquin Regional High School.
Ownership History
Date
Name
Owned For
Owner Type
Purchase Details
Closed on
Mar 4, 2025
Sold by
Mason Christopher C and Mason Lynne M
Bought by
Lynne M Mason T M and Lynne Mason
Current Estimated Value
Purchase Details
Closed on
Jan 15, 2008
Sold by
Mason Christopher C and Mason Lynne M
Bought by
Mason Christopher C and Mason Lynne M
Purchase Details
Closed on
Sep 27, 1996
Sold by
Page David C and Page Hope H
Bought by
Mason Chris C and Sacchetti Lynne
Home Financials for this Owner
Home Financials are based on the most recent Mortgage that was taken out on this home.
Original Mortgage
$157,950
Interest Rate
7.83%
Mortgage Type
Purchase Money Mortgage
Purchase Details
Closed on
Jul 30, 1993
Sold by
Hammarstedt Lars B and Hammarstedt Kerstin
Bought by
Page David and Page Hope H
Purchase Details
Closed on
Jan 15, 1993
Sold by
Carlson Dana and Carlson Joanne
Bought by
Hammarstedt Lars B and Hammarstedt Kerstin
Create a Home Valuation Report for This Property
The Home Valuation Report is an in-depth analysis detailing your home's value as well as a comparison with similar homes in the area
Home Values in the Area
Average Home Value in this Area
Purchase History
| Date | Buyer | Sale Price | Title Company |
|---|---|---|---|
| Lynne M Mason T M | -- | None Available | |
| Lynne M Mason T M | -- | None Available | |
| Mason Christopher C | -- | -- | |
| Mason Christopher C | -- | -- | |
| Mason Chris C | $175,500 | -- | |
| Mason Chris C | $175,500 | -- | |
| Page David | $175,000 | -- | |
| Page David | $175,000 | -- | |
| Hammarstedt Lars B | $179,000 | -- | |
| Hammarstedt Lars B | $179,000 | -- |
Source: Public Records
Mortgage History
| Date | Status | Borrower | Loan Amount |
|---|---|---|---|
| Previous Owner | Hammarstedt Lars B | $157,000 | |
| Previous Owner | Hammarstedt Lars B | $157,950 |
Source: Public Records
Tax History Compared to Growth
Tax History
| Year | Tax Paid | Tax Assessment Tax Assessment Total Assessment is a certain percentage of the fair market value that is determined by local assessors to be the total taxable value of land and additions on the property. | Land | Improvement |
|---|---|---|---|---|
| 2025 | $11,969 | $839,900 | $271,000 | $568,900 |
| 2024 | $11,315 | $792,400 | $224,600 | $567,800 |
| 2023 | $10,412 | $704,000 | $212,100 | $491,900 |
| 2022 | $9,881 | $599,200 | $201,900 | $397,300 |
| 2021 | $9,526 | $556,400 | $183,400 | $373,000 |
| 2020 | $9,724 | $563,700 | $183,400 | $380,300 |
| 2019 | $9,165 | $534,400 | $177,900 | $356,500 |
| 2018 | $8,665 | $498,300 | $169,800 | $328,500 |
| 2017 | $8,405 | $483,300 | $169,800 | $313,500 |
| 2016 | $8,240 | $479,900 | $166,400 | $313,500 |
| 2015 | $7,266 | $434,300 | $169,200 | $265,100 |
| 2014 | $6,976 | $420,500 | $169,200 | $251,300 |
Source: Public Records
Map
Nearby Homes
- 349 Brigham St
- 12 Saddle Hill Dr
- 223 South St
- 2 Codman Way Unit 409
- 2 Codman Way Unit 113
- 2 Codman Way Unit 207
- 2 Codman Way Unit 110
- 2 Codman Way Unit 411
- 2 Codman Way Unit 105
- 2 Codman Way Unit 402
- 2 Codman Way Unit 5103
- 2 Codman Way Unit 111
- 2 Codman Way Unit 104
- 2 Codman Way Unit 203
- 2 Codman Way Unit 302
- 2 Codman Way Unit 109
- 2 Codman Way Unit 410
- 2 Codman Way Unit 112
- 2 Codman Way Unit 304
- 5 Peters Farm Way Unit 106
- 38 Juniper Brook Rd
- 34 Juniper Brook Rd
- 32 Juniper Brook Rd
- 4 Juniper Ln
- 6 Juniper Ln
- 2 Juniper Ln
- 23 Juniper Brook Rd
- 30 Juniper Brook Rd
- 25 Juniper Brook Rd
- 27 Juniper Brook Rd
- 19 Juniper Brook Rd
- 28 Juniper Brook Rd
- 29 Juniper Brook Rd
- 17 Juniper Brook Rd
- 1 Juniper Ln
- 42 Juniper Brook Rd
- 31 Juniper Brook Rd
- 26 Juniper Brook Rd
- 3 Juniper Ln
- 33 Juniper Brook Rd