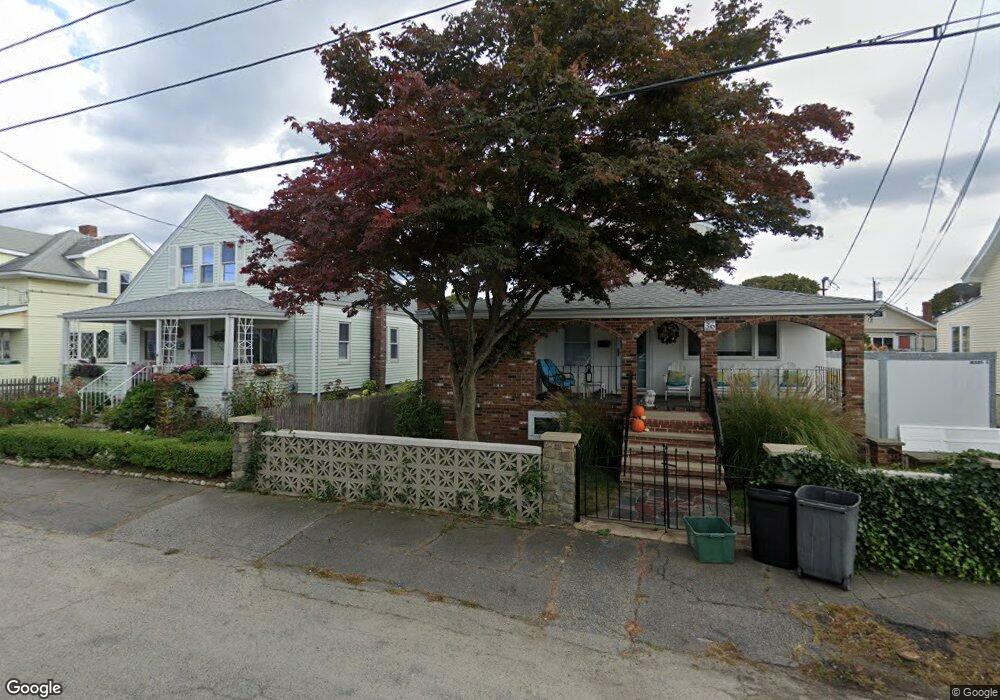
36 K St Hull, MA 02045
The Alphabets NeighborhoodEstimated Value: $703,000 - $773,000
2
Beds
2
Baths
1,833
Sq Ft
$406/Sq Ft
Est. Value
About This Home
This home is located at 36 K St, Hull, MA 02045 and is currently estimated at $744,215, approximately $406 per square foot. 36 K St is a home located in Plymouth County with nearby schools including Lillian M. Jacobs Elementary School, Memorial Middle School, and Hull High School.
Ownership History
Date
Name
Owned For
Owner Type
Purchase Details
Closed on
Nov 5, 2009
Sold by
Racicot Christine M
Bought by
Holmes Sarah E
Current Estimated Value
Home Financials for this Owner
Home Financials are based on the most recent Mortgage that was taken out on this home.
Original Mortgage
$256,272
Outstanding Balance
$167,848
Interest Rate
5.06%
Mortgage Type
Purchase Money Mortgage
Estimated Equity
$576,367
Purchase Details
Closed on
Apr 24, 1995
Sold by
Capone Benjamin M
Bought by
Farnham Meridieth J
Home Financials for this Owner
Home Financials are based on the most recent Mortgage that was taken out on this home.
Original Mortgage
$114,300
Interest Rate
8.55%
Mortgage Type
Purchase Money Mortgage
Purchase Details
Closed on
Jun 1, 1989
Sold by
Backus Owen F
Bought by
Capone Benjamin M
Create a Home Valuation Report for This Property
The Home Valuation Report is an in-depth analysis detailing your home's value as well as a comparison with similar homes in the area
Home Values in the Area
Average Home Value in this Area
Purchase History
| Date | Buyer | Sale Price | Title Company |
|---|---|---|---|
| Holmes Sarah E | $261,000 | -- | |
| Farnham Meridieth J | $127,000 | -- | |
| Capone Benjamin M | $127,500 | -- | |
| Capone Benjamin M | $127,500 | -- |
Source: Public Records
Mortgage History
| Date | Status | Borrower | Loan Amount |
|---|---|---|---|
| Open | Capone Benjamin M | $256,272 | |
| Previous Owner | Capone Benjamin M | $137,000 | |
| Previous Owner | Capone Benjamin M | $114,300 |
Source: Public Records
Tax History
| Year | Tax Paid | Tax Assessment Tax Assessment Total Assessment is a certain percentage of the fair market value that is determined by local assessors to be the total taxable value of land and additions on the property. | Land | Improvement |
|---|---|---|---|---|
| 2025 | $7,338 | $655,200 | $211,900 | $443,300 |
| 2024 | $5,352 | $459,400 | $202,100 | $257,300 |
| 2023 | $5,318 | $437,000 | $195,600 | $241,400 |
| 2022 | $5,170 | $412,300 | $182,600 | $229,700 |
| 2021 | $4,869 | $384,000 | $163,000 | $221,000 |
| 2020 | $4,424 | $345,100 | $169,500 | $175,600 |
| 2019 | $4,194 | $321,400 | $156,500 | $164,900 |
| 2018 | $4,043 | $305,400 | $156,500 | $148,900 |
| 2017 | $4,043 | $294,700 | $156,500 | $138,200 |
| 2016 | $3,796 | $281,600 | $143,400 | $138,200 |
| 2015 | $3,608 | $258,800 | $120,600 | $138,200 |
| 2014 | $3,454 | $249,000 | $110,800 | $138,200 |
Source: Public Records
Map
Nearby Homes
Your Personal Tour Guide
Ask me questions while you tour the home.