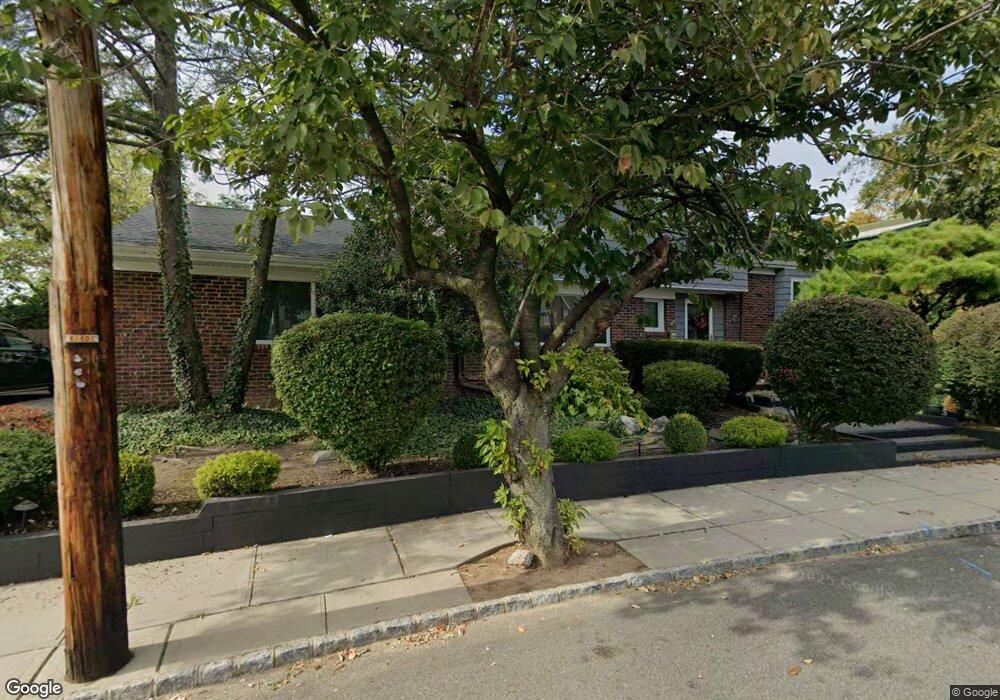
36 Kingswood Rd Unit 42 Weehawken, NJ 07086
Estimated Value: $957,000 - $2,043,000
4
Beds
4
Baths
2,490
Sq Ft
$635/Sq Ft
Est. Value
About This Home
This home is located at 36 Kingswood Rd Unit 42, Weehawken, NJ 07086 and is currently estimated at $1,580,372, approximately $634 per square foot. 36 Kingswood Rd Unit 42 is a home located in Hudson County with nearby schools including Daniel Webster School, Theodore Roosevelt School, and Weehawken High School.
Ownership History
Date
Name
Owned For
Owner Type
Purchase Details
Closed on
Apr 5, 2019
Sold by
Popvski Naum and Popvski Gordana
Bought by
Pinal Richard and Garcia Pinal Lilia S
Current Estimated Value
Home Financials for this Owner
Home Financials are based on the most recent Mortgage that was taken out on this home.
Original Mortgage
$108,000
Outstanding Balance
$95,524
Interest Rate
4.4%
Mortgage Type
Future Advance Clause Open End Mortgage
Estimated Equity
$1,484,848
Purchase Details
Closed on
May 18, 2012
Sold by
Popovski Naum and Popovski Gordana
Bought by
Popovski Naum
Home Financials for this Owner
Home Financials are based on the most recent Mortgage that was taken out on this home.
Original Mortgage
$938,250
Interest Rate
3.85%
Mortgage Type
Reverse Mortgage Home Equity Conversion Mortgage
Create a Home Valuation Report for This Property
The Home Valuation Report is an in-depth analysis detailing your home's value as well as a comparison with similar homes in the area
Home Values in the Area
Average Home Value in this Area
Purchase History
| Date | Buyer | Sale Price | Title Company |
|---|---|---|---|
| Pinal Richard | $1,080,000 | Westcor Land Title Ins Co | |
| Popovski Naum | -- | None Available |
Source: Public Records
Mortgage History
| Date | Status | Borrower | Loan Amount |
|---|---|---|---|
| Open | Pinal Richard | $108,000 | |
| Previous Owner | Pinal Richard | $364,000 | |
| Previous Owner | Popovski Naum | $938,250 |
Source: Public Records
Tax History Compared to Growth
Tax History
| Year | Tax Paid | Tax Assessment Tax Assessment Total Assessment is a certain percentage of the fair market value that is determined by local assessors to be the total taxable value of land and additions on the property. | Land | Improvement |
|---|---|---|---|---|
| 2025 | $23,471 | $1,160,200 | $852,600 | $307,600 |
| 2024 | $22,450 | $1,160,200 | $852,600 | $307,600 |
| 2023 | $22,450 | $1,160,200 | $852,600 | $307,600 |
| 2022 | $20,056 | $1,080,000 | $852,600 | $227,400 |
| 2021 | $19,753 | $1,080,000 | $852,600 | $227,400 |
| 2020 | $20,427 | $1,136,100 | $852,600 | $283,500 |
| 2019 | $19,484 | $1,136,100 | $852,600 | $283,500 |
| 2018 | $19,473 | $1,136,100 | $852,600 | $283,500 |
| 2017 | $19,868 | $375,000 | $282,500 | $92,500 |
| 2016 | $18,975 | $375,000 | $282,500 | $92,500 |
| 2015 | $19,013 | $375,000 | $282,500 | $92,500 |
| 2014 | $18,356 | $375,000 | $282,500 | $92,500 |
Source: Public Records
Map
Nearby Homes
- 56-58 Bonn Place
- 51 Bonn Place
- 407 Park Ave
- 88 Sterling Ave
- 1000 Avenue at Port Imperial Unit PH703
- 1000 Avenue at Port Imperial Unit 410
- 800 Avenue at Port Imperial Blvd Unit 821
- 1000 Avenue at Port Imperial Unit PH702
- 800 Avenue at Port Imperial Blvd Unit 308
- 800 Avenue at Port Imperial Blvd Unit 508
- 1000 Avenue at Port Imperial Unit 614
- 800 Avenue at Port Imperial Blvd Unit 517
- 800 Avenue at Port Imperial Blvd Unit 918
- 800 Avenue at Port Imperial Blvd Unit 920
- 800 Avenue at Port Imperial Blvd Unit 305
- 800 Avenue at Port Imperial Blvd Unit 318
- 76 Hackensack Plank Rd
- 3218 Pleasant Ave
- 150 Henley Place Unit 404
- 117 Hackensack Plank Rd
- 36 Kingswood Rd Unit 40
- 40 Kingswood Rd
- 30 Kingswood Rd Unit 34
- 44 Kingswood Rd Unit 48
- 53 Kingswood Rd Unit 55
- 53 Kingswood Rd Unit House
- 24 Kingswood Rd Unit 28
- TH3 Henley Place Unit TH3
- 57 Kingswood Rd
- 50 Kingswood Rd Unit 54
- 45 Kingswood Rd Unit 47
- 45-47 Kingswood Rd Unit 2
- 45-47 Kingswood Rd Unit 1
- 45-47 Kingswood Rd
- 61 Kingswood Rd Unit 63
- 61-63 Kingswood Rd
- 64 Kingswood Rd
- 66 Kingswood Rd
- 75 Kingswood Rd
- 41 Kingswood Rd Unit 43