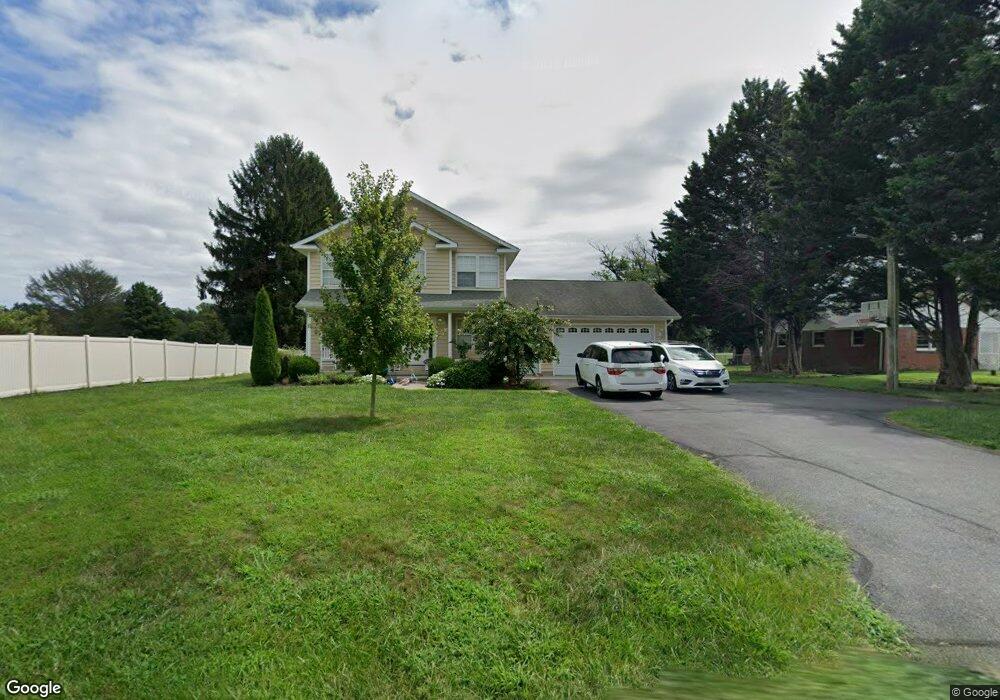
36 Kirks Mill Ln North East, MD 21901
Estimated Value: $370,076 - $450,000
--
Bed
3
Baths
2,091
Sq Ft
$202/Sq Ft
Est. Value
About This Home
This home is located at 36 Kirks Mill Ln, North East, MD 21901 and is currently estimated at $422,019, approximately $201 per square foot. 36 Kirks Mill Ln is a home located in Cecil County with nearby schools including Calvert Elementary School, North East Middle School, and North East High School.
Ownership History
Date
Name
Owned For
Owner Type
Purchase Details
Closed on
May 29, 2020
Sold by
Moir Dusten R
Bought by
Marttinen Landon E and Marttinen Katherine O
Current Estimated Value
Home Financials for this Owner
Home Financials are based on the most recent Mortgage that was taken out on this home.
Original Mortgage
$282,828
Outstanding Balance
$251,173
Interest Rate
3.3%
Mortgage Type
New Conventional
Estimated Equity
$170,846
Purchase Details
Closed on
Oct 27, 2011
Sold by
Granger Luke M and Granger Maia J
Bought by
Moir Dusten R
Home Financials for this Owner
Home Financials are based on the most recent Mortgage that was taken out on this home.
Original Mortgage
$197,455
Interest Rate
3.75%
Mortgage Type
FHA
Purchase Details
Closed on
Dec 22, 2005
Sold by
Mischler Linda Lee
Bought by
Granger Luke M and Granger Maia J
Create a Home Valuation Report for This Property
The Home Valuation Report is an in-depth analysis detailing your home's value as well as a comparison with similar homes in the area
Home Values in the Area
Average Home Value in this Area
Purchase History
| Date | Buyer | Sale Price | Title Company |
|---|---|---|---|
| Marttinen Landon E | $280,000 | Bayside Ttl Setmnt Svcs Llc | |
| Moir Dusten R | $230,000 | Bayside Title Settlement Ser | |
| Granger Luke M | $120,000 | -- |
Source: Public Records
Mortgage History
| Date | Status | Borrower | Loan Amount |
|---|---|---|---|
| Open | Marttinen Landon E | $282,828 | |
| Previous Owner | Moir Dusten R | $197,455 | |
| Closed | Granger Luke M | -- |
Source: Public Records
Tax History Compared to Growth
Tax History
| Year | Tax Paid | Tax Assessment Tax Assessment Total Assessment is a certain percentage of the fair market value that is determined by local assessors to be the total taxable value of land and additions on the property. | Land | Improvement |
|---|---|---|---|---|
| 2025 | $3,075 | $275,500 | $67,900 | $207,600 |
| 2024 | $2,645 | $268,200 | $0 | $0 |
| 2023 | $2,241 | $260,900 | $0 | $0 |
| 2022 | $2,916 | $253,600 | $67,900 | $185,700 |
| 2021 | $2,858 | $252,000 | $0 | $0 |
| 2020 | $2,948 | $250,400 | $0 | $0 |
| 2019 | $2,870 | $248,800 | $67,900 | $180,900 |
| 2018 | $2,817 | $239,000 | $0 | $0 |
| 2017 | $2,481 | $229,200 | $0 | $0 |
| 2016 | $2,479 | $219,400 | $0 | $0 |
| 2015 | $2,479 | $219,400 | $0 | $0 |
| 2014 | $2,339 | $219,400 | $0 | $0 |
Source: Public Records
Map
Nearby Homes
- 226 Old Farmington Rd
- 91 Bard Cameron Rd
- 521 England Creamery Rd Unit 3 PARCEL
- 521 England Creamery Rd Unit 2 PARCEL
- 521 England Creamery Rd Unit 1 PARCEL
- 0 Old Bayview Rd
- 310 Old Zion Rd
- 18 Madison Paige Dr
- 424 Bailiff Rd
- 42 Madison Paige Dr
- Topaz Plan at Montgomery Oaks
- Frankford Plan at Montgomery Oaks
- Hamilton Plan at Montgomery Oaks
- Pearl Plan at Montgomery Oaks
- Roosevelt Plan at Montgomery Oaks
- Rehoboth Plan at Montgomery Oaks
- Chaucer II Plan at Montgomery Oaks
- Opal Plan at Montgomery Oaks
- Ruby Plan at Montgomery Oaks
- Jefferson Plan at Montgomery Oaks
- 22 Kirks Mill Ln
- 50 Kirks Mill Ln
- 23 Kirks Mill Ln
- 47 Kirks Mill Ln
- 16 Kirks Mill Ln
- 58 Kirks Mill Ln
- 7 Kirks Mill Ln
- 0 Joseph Biggs Hwy Unit 1006552128
- 0 Joseph Biggs Hwy Unit 1009363236
- 0 Joseph Biggs Hwy Unit 1008831052
- 0 Joseph Biggs Hwy Unit 1004540554
- 55 Kirks Mill Ln
- 76 Kirks Mill Ln
- 0 Kirks Mill Ln
- 0 Kirks Mill Ln Unit 1004540612
- 0 Kirks Mill Ln Unit 1004540534
- 71 Kirks Mill Ln
- 2454 Joseph Biggs Memorial Hwy
- 59 Kirks Mill Ln
- 3034 Joseph Biggs Memorial Hwy