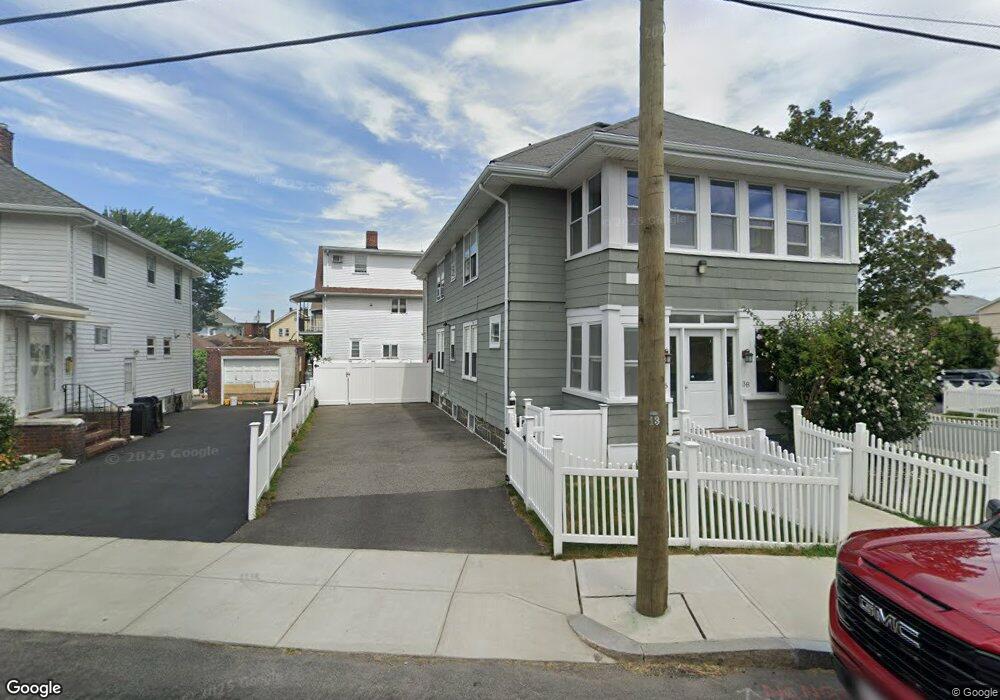
36 Lancaster St Quincy, MA 02169
Quincy Point NeighborhoodEstimated Value: $859,783 - $1,029,000
4
Beds
4
Baths
2,574
Sq Ft
$361/Sq Ft
Est. Value
About This Home
This home is located at 36 Lancaster St, Quincy, MA 02169 and is currently estimated at $930,196, approximately $361 per square foot. 36 Lancaster St is a home located in Norfolk County with nearby schools including Point Webster Middle School, Clifford H. Marshall Elementary School, and Quincy High School.
Ownership History
Date
Name
Owned For
Owner Type
Purchase Details
Closed on
Nov 30, 2011
Sold by
Soundview Home Loan T
Bought by
Callaghan David
Current Estimated Value
Home Financials for this Owner
Home Financials are based on the most recent Mortgage that was taken out on this home.
Original Mortgage
$291,406
Outstanding Balance
$203,969
Interest Rate
4.5%
Mortgage Type
FHA
Estimated Equity
$726,227
Purchase Details
Closed on
Apr 8, 2011
Sold by
Huynh Quang
Bought by
Soundview Home Loan
Purchase Details
Closed on
Apr 3, 2006
Sold by
Hickey Robert J and Hickey Pearl G
Bought by
Huynh Quang
Home Financials for this Owner
Home Financials are based on the most recent Mortgage that was taken out on this home.
Original Mortgage
$397,800
Interest Rate
6.32%
Mortgage Type
Purchase Money Mortgage
Create a Home Valuation Report for This Property
The Home Valuation Report is an in-depth analysis detailing your home's value as well as a comparison with similar homes in the area
Home Values in the Area
Average Home Value in this Area
Purchase History
| Date | Buyer | Sale Price | Title Company |
|---|---|---|---|
| Callaghan David | $269,900 | -- | |
| Soundview Home Loan | $240,000 | -- | |
| Huynh Quang | $442,000 | -- |
Source: Public Records
Mortgage History
| Date | Status | Borrower | Loan Amount |
|---|---|---|---|
| Open | Callaghan David | $291,406 | |
| Previous Owner | Huynh Quang | $397,800 |
Source: Public Records
Tax History
| Year | Tax Paid | Tax Assessment Tax Assessment Total Assessment is a certain percentage of the fair market value that is determined by local assessors to be the total taxable value of land and additions on the property. | Land | Improvement |
|---|---|---|---|---|
| 2025 | $9,222 | $799,800 | $256,500 | $543,300 |
| 2024 | $8,691 | $771,200 | $244,300 | $526,900 |
| 2023 | $8,155 | $732,700 | $222,100 | $510,600 |
| 2022 | $8,249 | $688,600 | $201,900 | $486,700 |
| 2021 | $8,293 | $683,100 | $201,900 | $481,200 |
| 2020 | $7,955 | $640,000 | $190,500 | $449,500 |
| 2019 | $7,546 | $601,300 | $176,400 | $424,900 |
| 2018 | $6,970 | $522,500 | $160,300 | $362,200 |
| 2017 | $7,020 | $495,400 | $152,700 | $342,700 |
| 2016 | $6,196 | $431,500 | $138,800 | $292,700 |
| 2015 | $5,963 | $408,400 | $130,900 | $277,500 |
| 2014 | $5,217 | $351,100 | $130,900 | $220,200 |
Source: Public Records
Map
Nearby Homes
- 5 Main St
- 51 Sumner St
- 97 Sumner St Unit 1
- 161 Sumner St Unit 2
- 35 Miller Stile Rd
- 388 Washington St Unit 301
- 388 Washington St Unit 205
- 388 Washington St Unit 405
- 388 Washington St Unit 202
- 388 Washington St Unit 203
- 388 Washington St Unit 401
- 388 Washington St Unit 302
- 388 Washington St Unit 204
- 388 Washington St Unit 101
- 388 Washington St Unit 304
- 66 Mcgrath Hwy Unit 302
- 66 Mcgrath Hwy Unit 402
- 66 Mcgrath Hwy Unit 309
- 66 Mcgrath Hwy Unit 201
- 16 Perley Place
- 36 Lancaster St Unit 2
- 36 Lancaster St Unit 1
- 36 Lancaster St Unit 36
- 38 Lancaster St
- 32 Lancaster St
- 21 Alden St Unit 210
- 19 Alden St
- 42 Lancaster St
- 15 Alden St
- 24 Alden St
- 35 Lancaster St
- 22 Alden St Unit 2
- 39 Lancaster St
- 20 Alden St
- 33 Lancaster St
- 24 Lancaster St
- 43 Lancaster St
- 11 Alden St
- 11 Alden St Unit 2
- 20 Fowler St
Your Personal Tour Guide
Ask me questions while you tour the home.